BTC-ETH daily chart
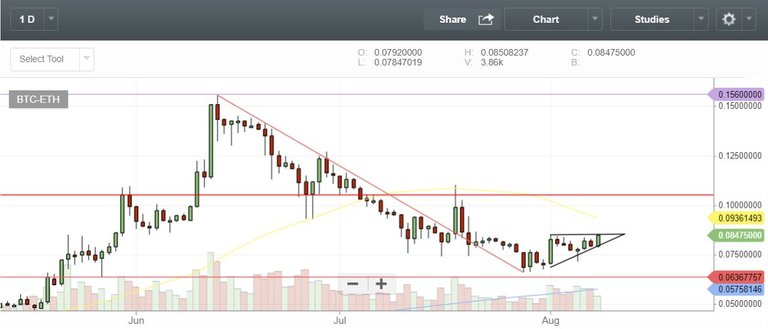
On the July 28th Ethereum price touched 0.066 BTC and it's safe to say that it was the bottom. On the daily chart price is now in the ascending triangle and the break out is going to happen before this week ends. First target is at 0.095 BTC and we have to keep an eye on the 50 day moving average (yellow line) which is presenting resistance from above. It might force you to take a profit earlier at the 0.093 BTC.
BTC-ETH daily
BTC-ETH weekly
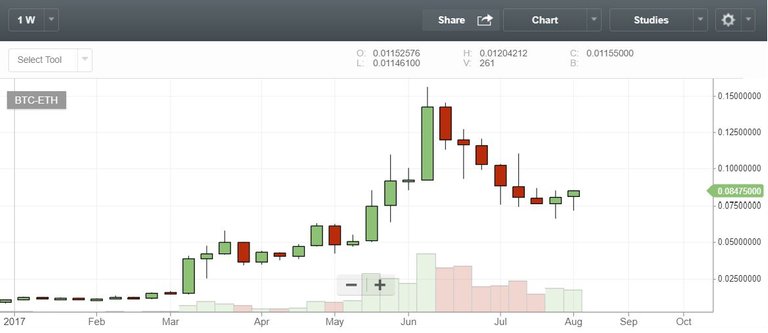
After six weekly candles the colors have finally switched. This weeks candle is trading above previous week, which means that traders are opening long positions right now. The border has been crossed less than an hour ago, this will trigger a rise in the demand most likely and the price will follow.
BTC-ETH weekly
Previous posts
- Bitcoin technical analysis after August 1st:
- Ethereum Classic technical analysis:
- Bitcoin Cash (ViaBTC) - User Activated Hard Fork (UAHF): https://steemit.com/bitcoin/@eviljedi/bitcoin-technical-analysis-after-august-1st https://steemit.com/trading/@eviljedi/ethereum-classic-technical-analysis https://steemit.com/bitcoin/@eviljedi/bitcoin-cash-viabtc-user-activated-hard-fork-uahf
If you like my content
Don't forget to Upvote, Resteem and Follow me @eviljedi


Thanks
ETH price hit 0.094 BTC 4 hours ago, that was the time to take profit. If you didn't do that, don't worry! There is doing to be 1-2 day pull back and it's going to rally up even more most likely.
@eviljedi please keep on posting. dude. I love your predictions.
Will do! A lot of indecision in the market at the moment. Charts are chaotic and unpredictable - mostly pump and dumps. Maybe when the Bitcoin starts going above $4500 we will see some clarity in the market.