Ripple/Bitcoin (XRPBTC) was in a symmetrical triangle for a while and it finally broke out.
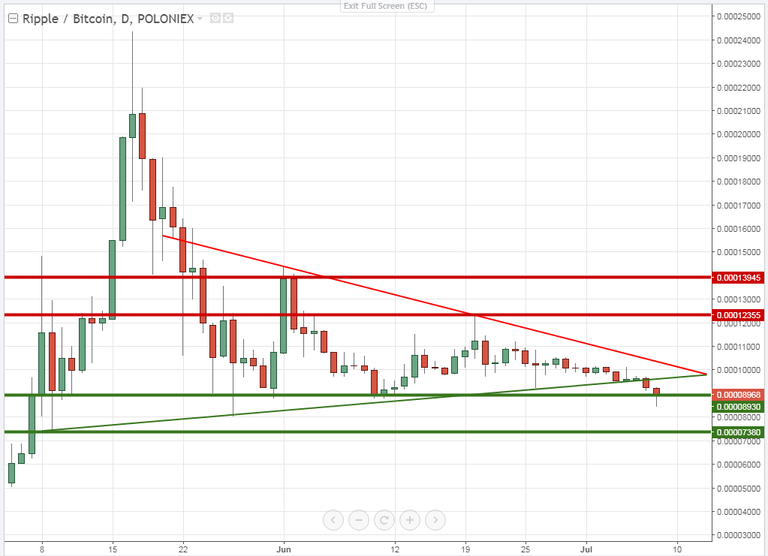
I added some support and resistance levels where the price might react.
Price is dropping and it stopped at one of my support/resistance levels I put on my chart.
Price is testing that support level (0.00008930) for the third time now,which happens to be a strong support level.
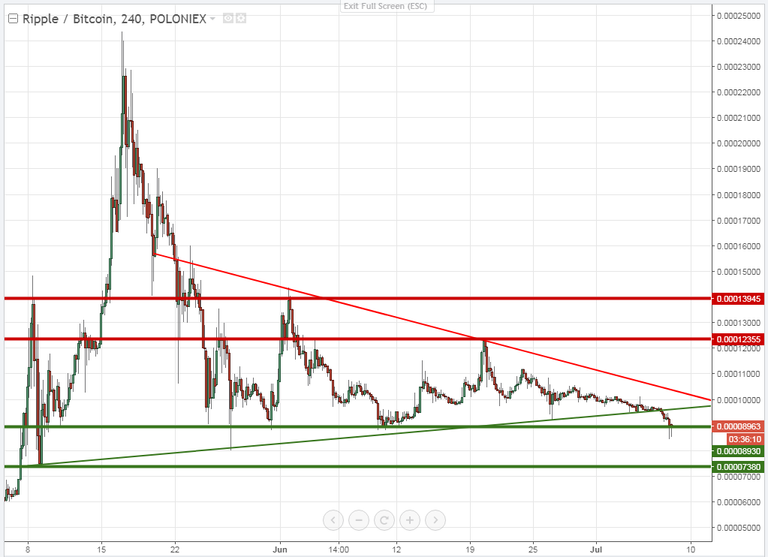
Possible scenarios:
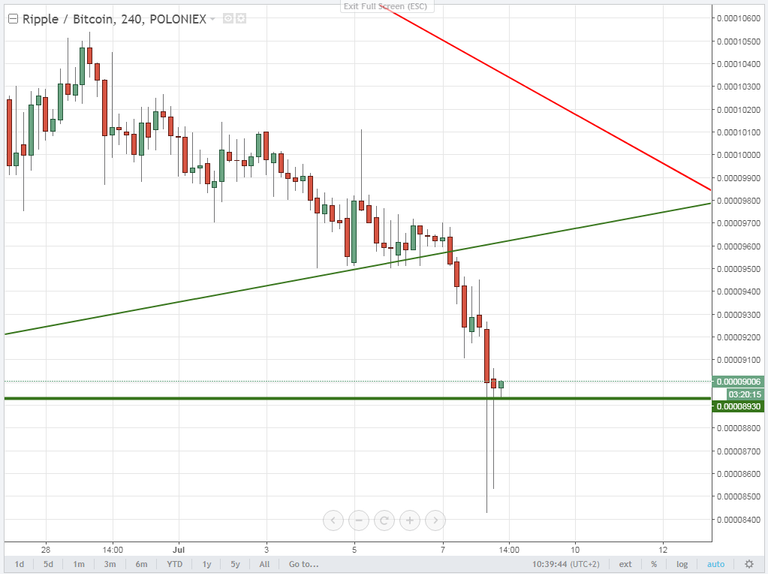
Price tests the current support level (0.00008930) and it finally breaks through and moves to the next support level (0.00007380)
Price tests the current support level and it moves back up and test the broken trendline (the support line of the symmetrical triangle)
Price moves back up tests the broken triangle and shoots upside to the resistance levels
There is other side of the coin as well. There symmetrical triangles don't signal for uptrend in the price. They show how much price is going to move, but not which way it's going. My guess would be that the price will lose 0.00005 BTC of its value.
Of course 3 days ago I posted about this current pair and I explained how symmetrical triangles work so find some time and check it out.
I just shared my opinion based on my trading experience that what could happen with the price hitting those levels and the influence of those patterns.
Thanks for commenting https://steemit.com/trading/@fisnikk/where-is-ripple-headed
Come on xrp! Dont drop any further
It's going up soon I can feel it lol
I have been thinking this since its major drop haha
I've been thinking this since my first investment lol