original post can be found on my blog http://crocotrading.com/cryptocurrencies/ta-ontology-ont-btc-long-position/
Context - daily chart
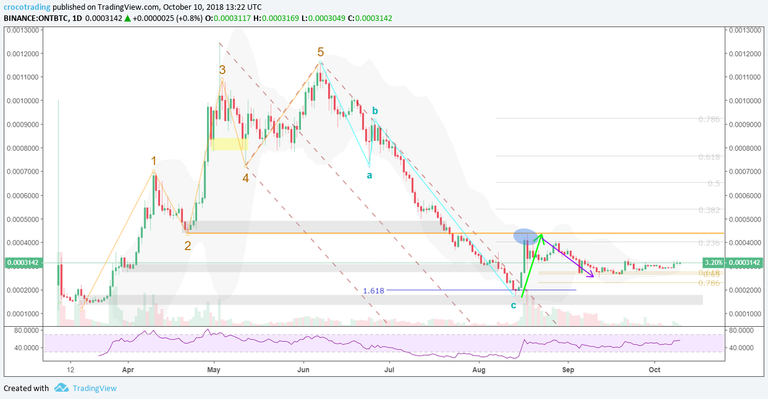
Demand zones
I have identified 3 demand zones on the daily chart (grey rectangles) and one on the 4-hour chart (yellow rectangle). As you can see, the yellow demand zone was pretty effective but the demand zones around 0.00047 and 0.0003 did not make a good job. On the other hand, the lowest grey demand zone did really well, the price immediatly bounced back once it touched the upper boundary of the area.
Price action with Elliott waves
From March 2018 to June 2018, we had a smooth impulsive wave with a 12345 subwaves structure in orange. According to Elliott wave theory, a corrective phase always follows an impulsive wave. It is hard to properly identified the exact sequence of a corrective phase. From the data we have, it seems like the corrective phase (in teal) was a sharp ABC correction with wave C equal to 1.618 of wave A.
Last moves from an elliott wave standpoint are represented by the green arrow and the purple arrow. It looks like an impulsive wave (which stopped on the 0.236 retracement level) followed by a corrective wave which we are right in.
Andrew's Pitchfork
As I always do, I have drawn an andrew's pitchfork using pivots points to see if there was any useful information. During the downward move, price was litteraly stuck under the upper parralel until we broke the parralel on August 16.
Volume
Huge volume after the price reversal in August.
Context - 4-hour chart
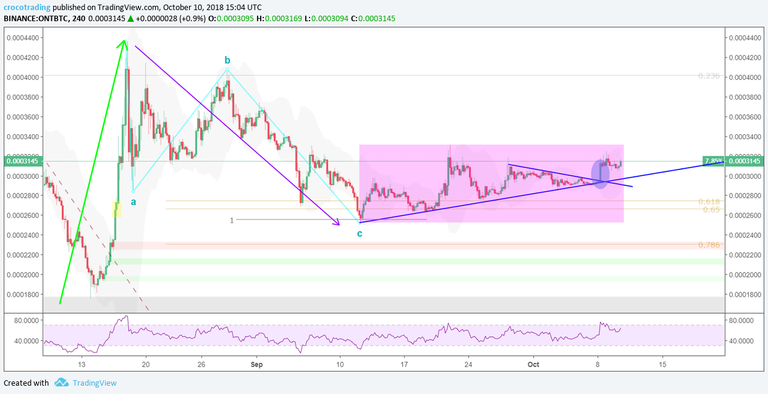
Thanks to the 4-hours chart, we have more precise information on the price action of the two waves represented by the green arrow and the purple arrow.
The first wave clearly looks like an impulsive wave. The corrective, as always, is more tricky. One potential subcount (my favorite one) is an ABC wave (in teal), with wave C equal to a 1 to 1 extension of wave A. The wave C almost stopped in the 0.618-0.65 retracement area of the first wave. A simple ABC zigzag countdown and a retracement close to 0.618 is what you typically look for a wave 2.
I am less confident on what is happening in the pink area. My favorite scenario would be a leading diagonal but I will need more data to confirm this hypothesis.
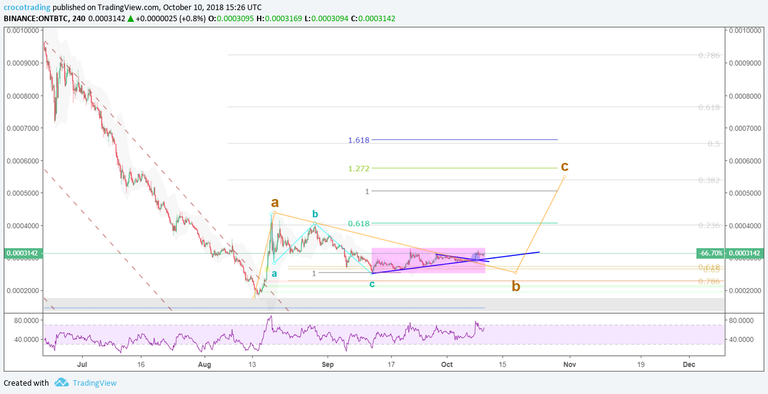
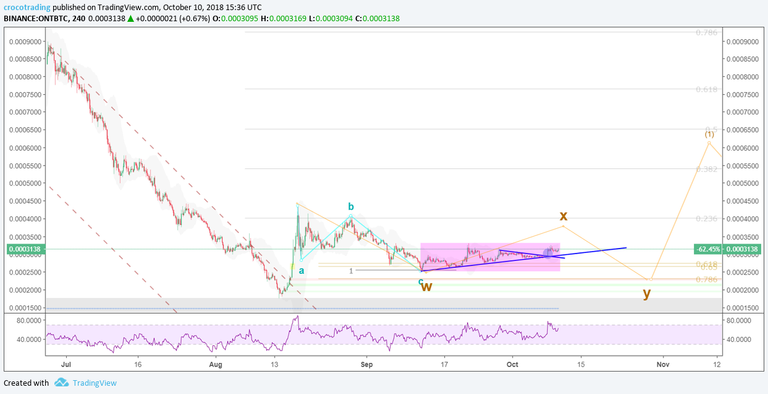
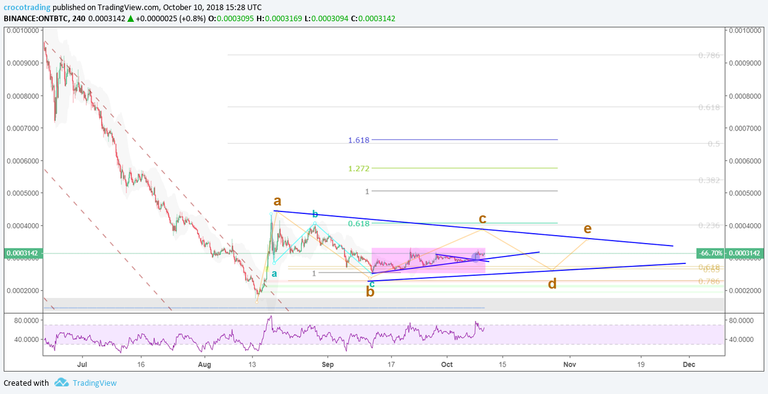
Possibles scenarios
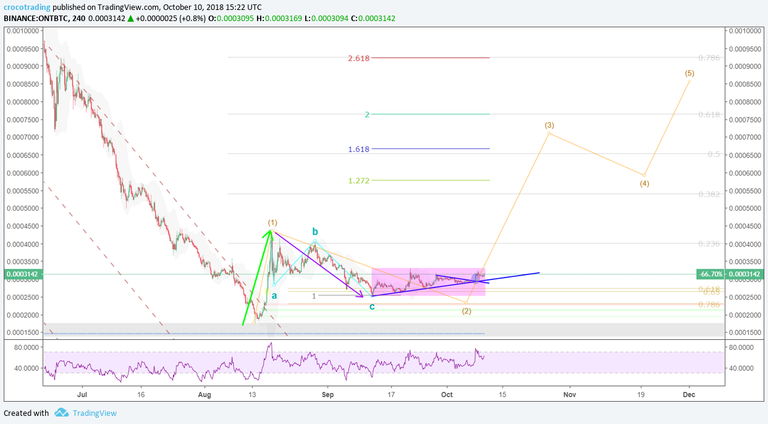
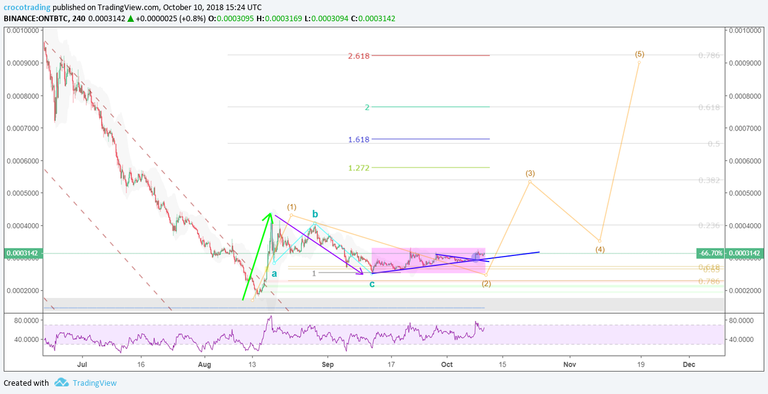
Some of the possible scenarios I am thinking about. Don't take into account the length and size of waves which are unpredictable.
My trading strategy
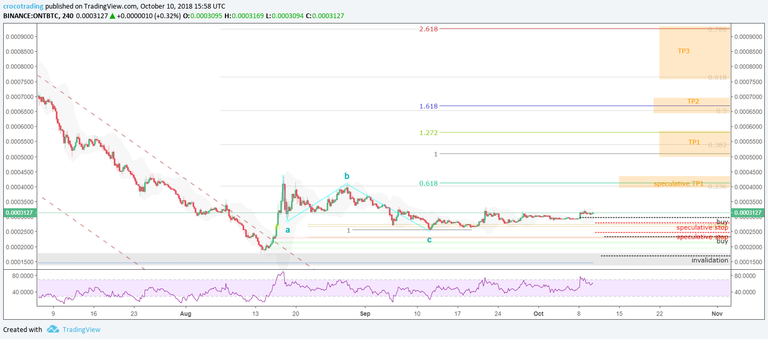
I have entered a long position at 0.00031. I have two possible strategies in mind and I am not yet sure which one I will apply since it will depend on price action. I might even allocate a percentage of my position for each strategies since they are totally compatible.
The first approach is highly speculative and aggressive. It implies to stop the trade if price goes under some of the short term supports (see red dot line). I have placed potential stop (SL) at 0.00028 and 0.000247. For this strategy, I have placed the first TP around 0.0004, I would probably even take some profits before to be in a riskless trade (profits taken pay the stoploss). This strategy requires to be active, particularly when the price arrives on TP or SL levels in order to take a decision based on price action. If you take a loss, the trade is not over, you will have to look for new speculative entry.
The second approach is more long-term oriented. Half of the position should already be open. The other half would be open if we drop to lower price (For example, 25% at 0.00025 and 25% at 0.0002). Plan is to take first profit in the TP1 area (percentage might vary) then in TP2 and TP3 areas. Stop loss is normally under the invalidation treshold but it might be more interesting to just keep the position in a buy-and-hold rather than to take a 50% loss. Again, this will all depend on the price action.
Steemit : https://steemit.com/@focuscrypto
Tradingview : https://www.tradingview.com/u/crocotrading/
Facebook : https://www.facebook.com/crocotrading/
Twitter : https://twitter.com/crocotrading
Legal disclaimer : Opinions, markets informations, analyses and any statements made on crocotrading.com website constitute on no account investment advices. The information provided on this website and any accompanying material is for informational purposes only. It should not be considered financial or investment advice of any kind. One should consult with a financial or investment professional to determine what may be best for your individual needs.