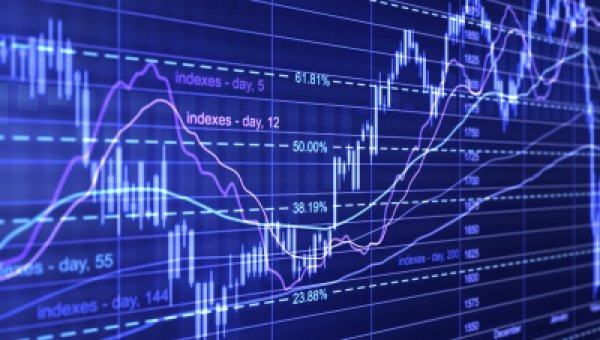
Forex indicators are one of the trader's main helpers. They are two-dimensional graphs based on mathematical functions. On the horizontal axis of the graph, the time is located in a scale corresponding to the price scale. The magnitude of the mathematical function is represented by the vertical axis. The graphs of some indicators are superimposed on the main price graph, which monitors the relationship between the main chart and the indicator. In others, the graph of the indicator is located in a separate coordinate system, just below the main price graph.
The main division of the indicators is the following trend and oscillators.

The first type is used in a pronounced trend market and allows us to determine the beginning and the end of the trend. This type of indicator is more reliable than the two types, but with a longer delay in time. Typical representatives of this group are the various variants of the mean values - Moving averages.
The second type - the oscillators are suitable for less pronounced trends and for lateral price movements. The signals that give the oscillators are of a lower degree of reliability, but they are faster, in many cases overtaking the movements of the main plot. Typical oscillators are Momentum, Relative Power Index (RSI), and MACD, Stochastics.
Combinations of both types of indicators are often used, composite indicators containing elements of both types. Stronger strategies are becoming increasingly popular under the name "Synergistic Systems", which are based on a number of mutually complementary properties of their indicators. Synergic systems enable the generation of signals with a higher degree of reliability.