Full disclosure: I wrote this article before I joined Hive (posted on Medium), but I've adjusted certain elements.
What is Technical Analysis?
It's that thing you hear those "influencers" with their 🤑🚀-emojis say you can quit your job and make thousands a day, while sceptics claim you’ll lose all your money. The truth is somewhere in between.
The simplest explanation is this:
"Technical Analysis is the art of utilizing graphical representations of human behavior expressed through prices, volume & sentiment in order to forecast future prices."
Now, although the definition might seem straightforward, there’s actually a lot of complexity to it. In order to understand it, we must start off with a few core principles:
- Financial markets discount every piece of available information
-This is simultaneously the most important and the most difficult aspect to understand. In a freely traded market (stocks, bonds, currencies, commodities), every piece of available information is already factored into the current price.These "factors" influencing price range from monetary policy, geopolitics, growth or inflation expectations, sentiment, etc. Market participants are extremely efficient and continually push prices up or down in accordance with those FUTURE expectations.
This by no means suggests that the market is "always right"; it merely suggests that the factors that have happened, are expected to happen and could happen are already priced into the current market. The current price is not necessarily today’s price, it is what people expect it to be in the future based on the available information.
Example: That's why the stock market crashed in March 2020, because nobody was expecting a global pandemic to happen. Markets started scrambling to price in supply-chain disruptions, deaths, unemployment, etc. - Price-movements are caused by human behavior, which is repetitive and predictable
-Throughout history, prices have tended to rise when people are optimistic/greedy and fall when people are pessimistic/fearful. That core principle of human behavior has remained intact until today. It's all a cycle
Example: If we assume that (a) price movements are the manifestations of human behavior and (b) human behavior is predictable, it logically follows that (c)prices are predictable. If a chart pattern (a certain combination of price-movements) has historically shown to precede a rally or a fall in prices, it is fair to assume that that pattern will continue to do so in the future. - Trends persist
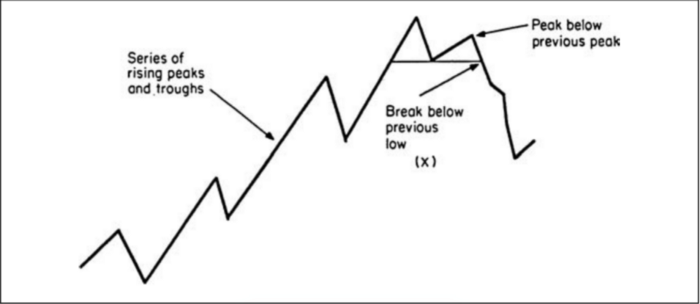
-Prices do not move randomly (argued by the so-called Random Walk Theory), nor do they move independent from previous price movements. They move up and down in trends. A trend can be defined as a prolonged period of price-movement in a certain direction. This means that last week/months price movements affects the movements for the next week/month.
A typical cycle consists of:
- Prices bottoming during a recession, during which insiders and long-term investors buy at extremely low prices.
- After prices start to rise, the rest of the finance-savvy people start to enter.
- As prices have gone up to record amounts, the general public starts to enter the market and you hear that your cousin spent his life-savings buying Dogecoin. Inevitably…
- The market becomes overleveraged with speculative interest and we get a recession, and the cycle begins anew. This entire process can take anywhere from 4–10 years depending on the market and the underlying conditions. During these cycles, prices have a tendency to persist going with the overall trend.
Example: Everyone who's experienced the 2017 Crypto hype knows exactly what this means.
If you can understand core tenets, congratulations! You understand the basics of Technical Analysis. If not, this is probably my favorite way to explain it in as little words as possible:
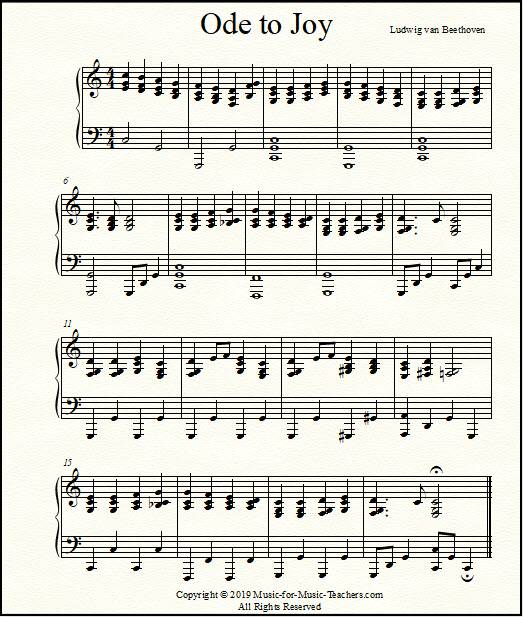
This piece of sheet music is nothing more than the graphical representation of music. A musician does not need to analyze the interplay of harmonies in order to play this piece of music. He can simply read & play the notes.
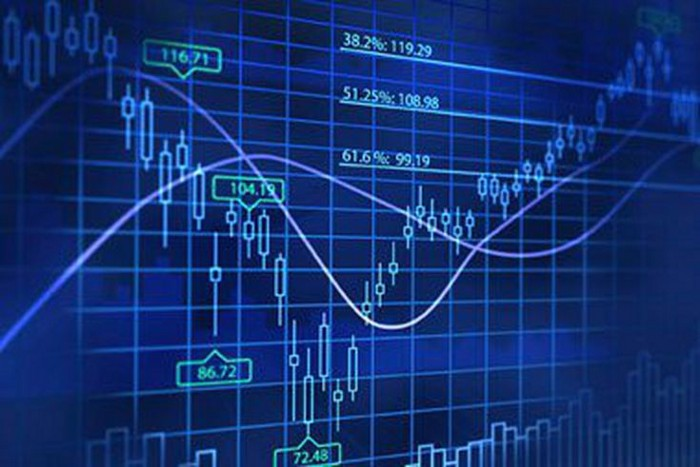
Similar to the sheet music, the chart (and all the lines in it) are the graphical representation of investor behavior.
If you've made it this far, congrats! You're doing great buddy; just a few more paragraphs to go.
So....If the sum of market participants are greedy/fearful, prices should be going up or down (respectively), and if there’s uncertainty prices would be going sideways/directionless. If we can identify the patterns in which these behaviors manifest we can eventually make a forecast of the possible future price.
How exactly can we use patterns to predict future price movements?
There are 100+ technical tools one can use at any time, or even a combination of tools. We’ll take a look at one of the simplest patterns called the Rectangle.
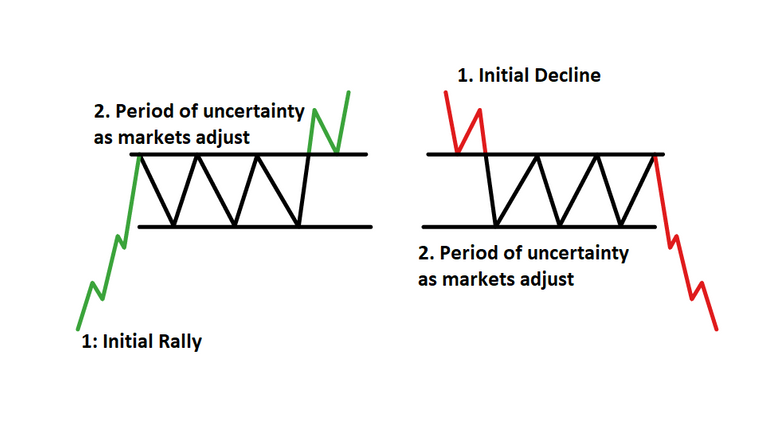
Markets don’t go straight up or straight down, they trend, then pause, then trend again. It’s a reflection of the battle between buyers and sellers. Prices can have an initial rally after which market participants recognize that prices have gone too high to quickly. Players might exit the market, pushing prices down to reflect a more accurate pricing of supply vs demand. The Rectangle visually represents the period in which buyers and sellers are almost equal in strength.
Simple example (notice how the period of uncertaint manifests in a rectangular shape:
Real world example (Microsoft):
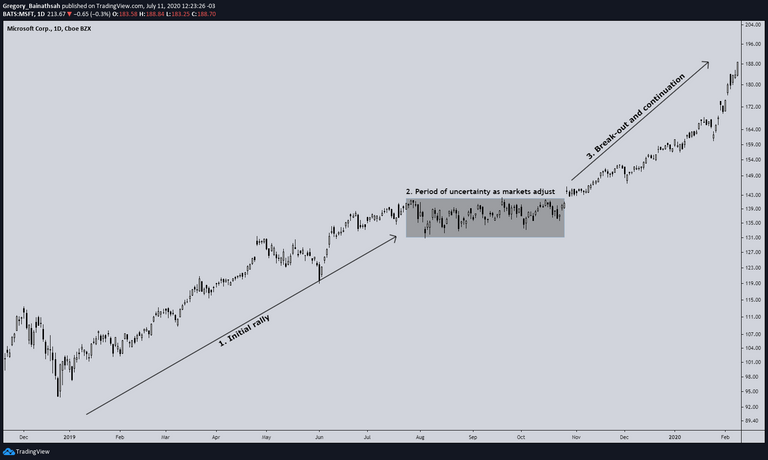
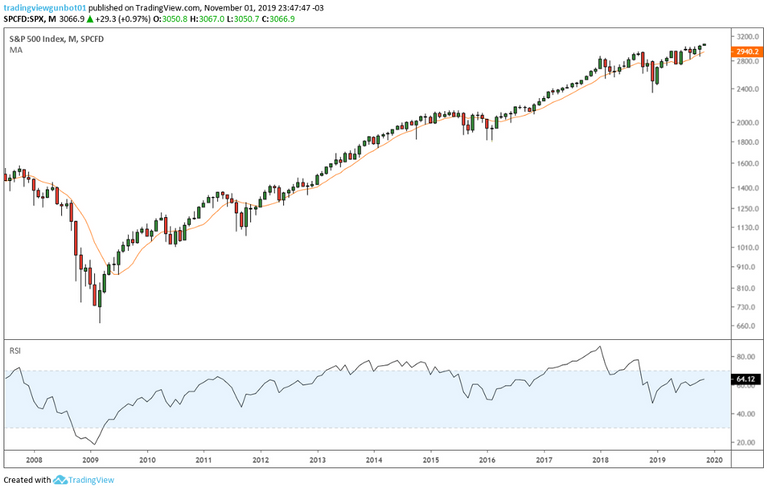
In the chart you can see that in the beginning of January 2019, prices had (step 1) rallied significantly until (step 2) around August after which they remained large directionless for around 100 days. Prices then (step 3) "broke the rectangle" and continued higher.
Common criticisms of Technical Analysis:
It's akin to gambling
While that isn’t incorrect, it certainly isn’t accurate. Technical Analysis is more of a subjective art than a science. Any one person can use any myriad of technical tools at any time, which means 100 analysts can see 100 different things when looking at the same chart (let alone when they’re using different tools). Regardless, that doesn’t change the predictive power of those patterns. The “Head & Shoulders” pattern for example has even been recognized by the US Federal Reserve as being reliable. That is a noteworthy achievement since academics are usually the most vocal critics of Technical Analysis.
“Technical Analysis is often wrong”
That is a fair criticism. Even the most reliable pattern doesn’t work all the time, and when people place their faith and hard-earned money in the forecasts it hurts emotionally and financially to have been wrong. While Technical Analysts try to “predict the future”, one must acknowledge that it’s impossible to be right every time. Perhaps a more accurate expression would be to say that the Technical Analyst “evaluates the weight of the evidence in order to make a probabilistic forecast of future price movements”, but that just makes it sound so boring 🤢. As Star Wars has taught us, “Only a Sith deals in absolutes”, and taking positions without evaluating the full weight of historical evidence as well as using safe risk-management will certainly cause you to lose all your money.
“The chart patterns themselves have no inherent predictive ability, they are merely a self-fulfilling prophecy”
“People buy on the upwards break of a Rectangle purely because they believe others will do so as well. Their argument is that the analysts have it backwards”.
That is false, since some patterns have existed worldwide, decades before the study of Technical Analysis existed (it is therefore an inductive philosophy instead of a deductive philosophy). Many patterns which are still used profitably today (even used in the charts above) date back to 18th century Japan. If anything, time has done nothing but strengthen the robustness and reliability of these patterns.
And there you go! An introductory lesson to Technical Analysis. If you've made it this far, way to go!
Any questions and/or comments, please feel free to share!
Extra resources: