What is Technical Analysis?
Technical Analysis is the art of identifying (price) trend reversal on the weight of evidence.
Peak and Trough Progression

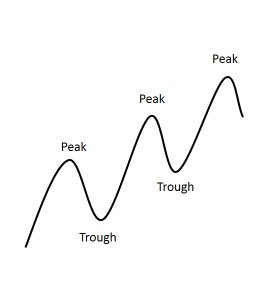
Peak and trough progression is the simplest of trend determining techniques .This technique was developed by Charles Dow's original observation, that a rising market moves in a series of waves. As we all know prices never move in a straight line, it always moves up and down. When a series of peaks and troughs are interrupted a trend reversal is signaled . The figure below the price is advancing in a series of waves, with each peak and trough higher than its predecessor. Then at point A the rally fails to move to a new high, and the reaction pushes it below the previous trough (Point B) and gives a signal the the trend has reversed.
.
FIGURE 1
Figure 2 below shows a declining market where the process above is reversed, at point C the price fails to take out the final low point. This indicates that a reversal is on the way, but the actual trend reversal is not signaled until it crosses point D. It is the not surprising that the price may fall below D again, however as long as the price stays above the previous trough the trend is still classified as bullish.

These are some of basics signs to look forward to when trading , it would help you make better trades but remember always do your research and don't depend on one indicator. Thanks for reading and happy trading .
Congratulations @kareem8622! You have completed some achievement on Steemit and have been rewarded with new badge(s) :
Click on any badge to view your own Board of Honor on SteemitBoard.
For more information about SteemitBoard, click here
If you no longer want to receive notifications, reply to this comment with the word
STOP