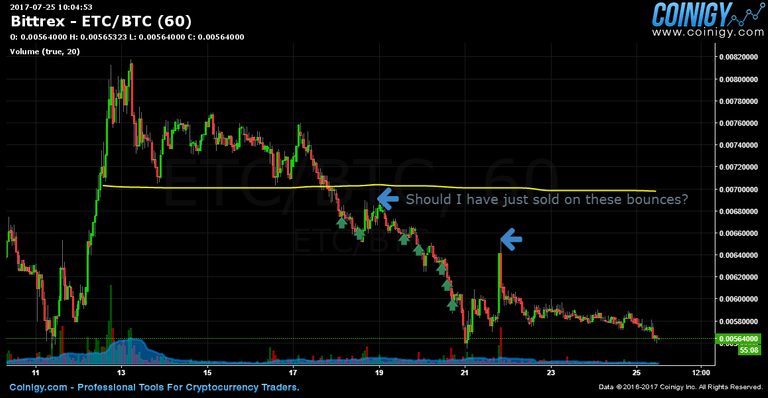
Did I misread the chart again? Last time I sold way too fast so I decided to hold this time. But it's been a long time and the price might actually fall below the next support. Me thinks that if there's no movement after august 1 I should sell this off.
You are viewing a single comment's thread from:
How far back into the chart did you look into?
You should view the bigger story of the chart by zooming out to at least 1 month, preferably 2 months, to make a better informed trade and if you're not seeing the bounces from cracked bases on the larger view then you know not to even take the trade.
I recommend the following approach:
Rinse and repeat until you get bored from making money from the market 😂
Hope this helps 🙏👍
Your time frame is a little small.. you need to be looking at a bigger picture to draw your bases.. if your looking at a week than you need to respond fast to bounces.. I dunno what to tell you with this chart..
Anyway, my rule of thumb is to never let a bounce get away from me without atleast participating.. so that means selling some on every bounce.. But honestly its your timeframe thats throwing you off.. you need to look at a bigger chart and run your odds, figure out what is a normal size bounce..
hey, thats what i like to see... Your evaluating the whole chart and now you have a good sense of your odds.. I would say that I probably wouldnt have taken a trade off the 700 break, but your odds are still very high, that you atleast get a break even trade..
On the second bounce, I would have sold some probably at least 50% of your total position. You profit off the last three trades which helps offset the costs from your first four.
I've made the same mistake quite a bit on my first couple weeks trading
I made the exact same mistake. If you look back in the chart you can see that the average bounce of the other bases is higher (around 12-15%%) and this 700 base is 8.8% so therefore it doesn't qualify as a base.