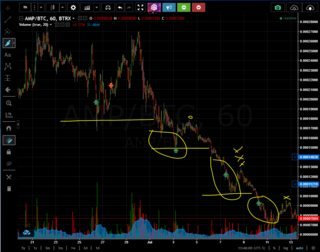
Yes.. I took some trades on this and I am in the red at the moment on it.. It has shown some extreme weakness, and would need to start to trade properly again for a month or so before I would start trading it again.. this is where im in .. 
the circles should have been save areas, and the X Xs represent the bounces that didnt reach there base.. so yeah, im not buying more unless we get a bounce.. the chart is no longer a high probability chart, so I will just hold and watch for now.. but you should not add money to a chart that is not trading properly..
Thanks for the clarification, I think I'm really starting to read these charts better each day due to your blog!
What position sizes are you taking per entry? Layering is great when price eventually recovers, but then are we just making really small nibbles when we don't get a chance to layer? If we take an account and partition off say 5% across each of 20 coins, are we entering something like 0.5%, 1%, 1.5%, 2% (4 trades of increasing size)? Seems like lots of small wins in that case until we can find a falling knife.
I often dont get a chance to layer, and am stuck making a small insignificant trade.. but its still profit and still safe.. I trade really small for my size.. I would guess that I dont even put 1% of my capital in all the little individual coin trades.. But on those big coins like ETH or BTC I will sometimes go up to 20 or 40% of my capital.. for huge trades.. it all comes down to risk reward, and making sure that your big money is in big moves on big coins but still in only the safest spots.. I wish i could give you some math formula, but no two trades are the same for me..