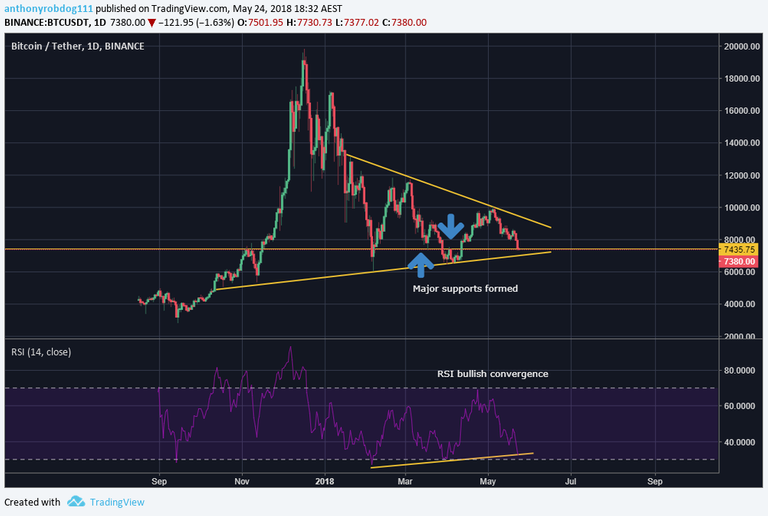
In times like these taking a step back and looking at longer term trends is always helpful, it hints more towards larger overall trends that might effect price action. In chart one we look at support points as well as a longer term trend line which will act as a strong support.
Chart 1: Overall picture.
Support/buy zones range from 7K-7.5K, if these are to be broken the next support will be at the previous lows.

Chart 2: Bearish (short term/hours) Bullish (Days/medium term)
The ABCDE correction is almost complete, we are at the bottom of the wedge and on strong support levels of 7.4K. There is still potential for it to go down further, but likely not below the sloped trend line.
