I like candle charts, but probably not just because of what they show but because it's what I 'grew up' on (I really prefer bar charts for price action trading). Most people use candles though, so it seems like a good topic to talk about.
This is probably going to be a long post on Candles so I'm going to split it up into much smaller chunks and post them separately.
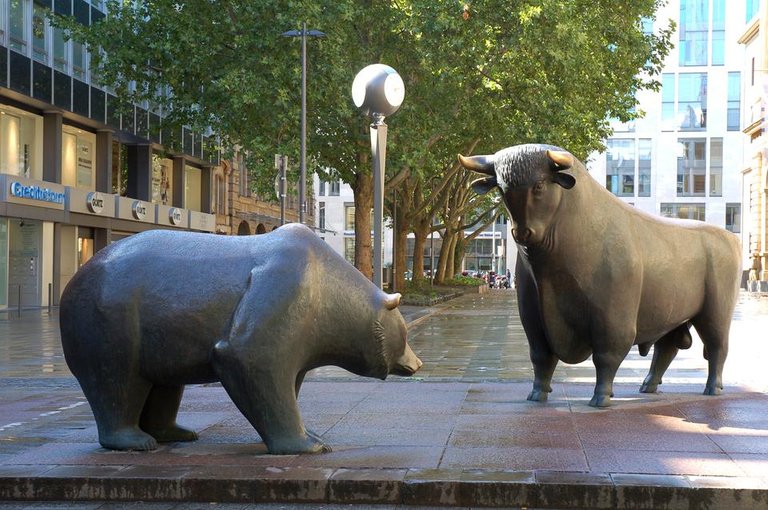
I wouldn't consider myself a weeb(ette?), but I do like some of the Japanese mythology when it comes to trading, especially when describing the stock market in martial terms. The mythology is full of heroic battles between the bulls and the bears, the constant push and pull of two opposing armies - it helps to visualise how market forces work.

The problem with candle formations is most people don't really understand them, or use them properly. Ok, it's a bold statement, but I'd like to share a few things I've learned about candles that'll hopefully help you in your trading, such as -
- All candle formations are the same pattern when viewed over different time periods.
- How to use longer term candles to trade shorter time periods with higher accuracy
- Common misconceptions and mistakes that all retail traders make when using candles
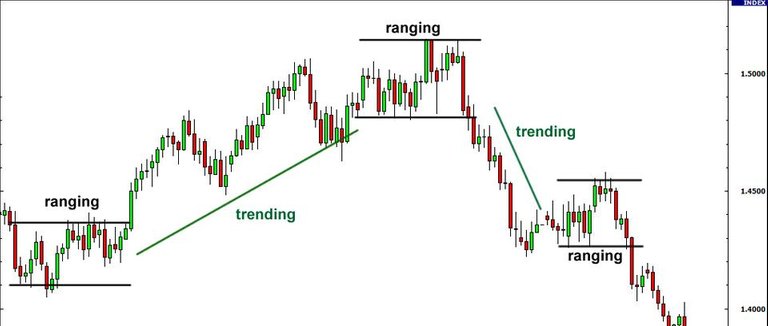
There are two candle patterns, reversals and ranging. I don't mean two different types of patterns, I literally mean two patterns. The market is either ranging or trending and the candle patterns either tell you the market trend has changed direction (reversal pattern) or the market is ranging (indecision).

So stay tuned for some hidden secrets about candlesticks that 'they' don't want you to know ! (shameless clickbait).
Hey, if some whales can earn $400 a post for single line articles then I need to be spacing stuff out more :-)
In my next article I'll explain how candle patterns are formed, why everyone sees different candle patterns on the same chart, and why you shouldn't trust other peoples predictions based on them.
Header image : independent.co.uk
Chart image : babypips.com
Bull and Bear : wikipedia.org
Images found via Google image search, no affiliation
About me -
I'm a full time financial trader, mostly in Forex and Commodities. I write for fun and try to help beginner traders get started, avoiding all the mistakes that I made. I'm always happy to chat or discuss ideas so please just give me a shout in the comments !
I'm currently trying to build up SP but everything I earn from Steemit is donated to a Steemit charity or worthy user.
Yes can not wait for you to show us some secrets.
I knew it. There is always a trick up those financial experts that I never could understand. I hope I can learn from you and trade better in the future. Can't wait ;)
the secrets are... everything you've been taught is wrong ;-) lolol
I never have met someone here who writes for fun and spending valuable time to support other who have similar interest to be successful. You are such an amazing person. I think it is hard for me to understand trading analysis :) . But thank you for your support to @SchoolForSDG4 . I hope you will have a lot of SP so you can support more worthy causes by upvotes.
After speaking with a friend we thought it would be better to build up some SP first, as I don't have any ! :-)
You are right. I am here for 2 years around but had not much SP like a whale. but when you have a lot of SP, you will get some retaliation and your voice will worth more. But I really think that growing slowly helps you to get real friends and loyal supporters. wish you best of luck.
thank you !
Shorter posts, really the way to go. NOW IF ONLY I COULD TEACH MYSELF THAT!
I'm looking forward to the rest of this series.
I prefer bars as well, it's a lot easier to see the horizontal progression since it reminds me of a chain of ladders that the price navigates around. The close of one is often very close to the start of another.
Looking forward to seeing more of your posts :)
thanks ! all my posts are aimed at beginners and people struggling to survive YouTube University, but hopefully some of it might be useful to more experienced traders as well.
I like bars a lot because they cleanly show expanding and contracting volatility, the highs and the lows. Most retail traders concentrate on the opens and closes because that's what they're taught, infact that's the topic of my next article.
I'll be doing an article shortly on candle patterns and gapping (which doesn't happen in forex or crypto but most candle patterns were designed to work around gaps). Decentralised 24hr markets don't have gaps, the close of one period is always the open of another...
Thanks, had viewed the candles on exchanges. Try to buy when low, mostly just holding now. Not an active trader. Did not about ranging and trending.
candles patterns aren't that really important for long term investments, they're more for short term / day trading as a way of measuring momentum.
I'm going to do a post sometime on the different market phases and the advantages of trading both, most people usually trade one or the other.
Crypto is really a long term strategy so I think a lot of my stuff won't apply to crypto much.