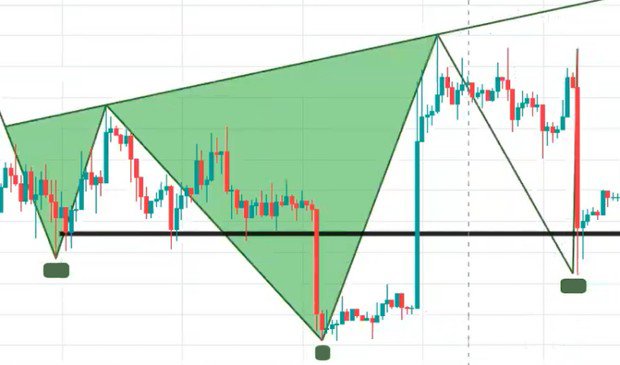
Judging when a reversal trend is about to happen and what to do when they happen is one of the hardest things for traders to master but also paradoxically one of the most profitable endeavor. 4 types of reversal patterns that can be spotted are W bottom, M head, head and should top, and head and should bottom which can appear in the same chart at a different time.
W Bottom
Generally used to spot a buy (long) reverse signal, it consists of two low points and one high point; it often appears when the price lowers and nears the support.

M Top
Generally used to spot a sell reverse signal (short), it consists of two high points and one low point; it often appears when the price rises and nears the resistance.

Head and Shoulders Bottom
Generally used to spot a buy (long) reverse signal, it consists of a "head" and two "shoulders" with the head position being lower than the shoulders and the shoulders’ positions will be nearly aligned in a horizontal line. When the right shoulder does not break through the left shoulder low, try to do more.

Head and Shoulders Top
Generally used to spot a sell (short) reversal signal, it consists of a "head" and two "shoulders" with the head position being higher than the two shoulders and the shoulders’ positions will be nearly aligned in a horizontal line. When the right shoulder does not break the height of the left shoulder, try to short.

Finding the Entry Point
When going long:
After a continuous decline in price, when a rising candle is larger than the previous falling candle, you can check and try to see if the candlestick patterns form a W or the a head and shoulders bottom, at which point you can try to enter the market. Go out when, after an increase in price, a falling candle is larger than the previous rising candle.
When shorting:
After a continuous rise in price, when a falling candle is larger than the previous rising candle, you can check and try to see if the candlestick patterns form a M or head and shoulder top, at which point you can try to enter the market. Go out when, after a fall in price, a rising candle is larger than the previous falling candle.
Examples
W Bottom Entry Point
Taking this picture as an example, the price continues to fall to 6782.3 next to a rising candle, this gives us a W pattern, which can be entered at 6870.9. The Stop-Loss point can be set at the previous low of 6782.3, and the Take-Profit point can set afterward depending on the price fluctuations. After a rise in price, the price starts to fall down. When a falling candle is much bigger than a previous rising candle, close your position.

M Top Entry Point
Using the following picture as an example, after a continuous increase the price rises from 3658.5 to 3717.9, a larger falling candle is present right after a rising candle, this gives us the M pattern. This can be shorted at 3658.5, with a Stop-Loss set at the high point of 3717.9. Maintain the position, until there is a continuous decline followed by a larger rising candle (3569.8), at which point you can take profit.

Head and Shoulders Entry Point
Using the picture below as an example, after a continuous rise, the price falls and the falling candle is larger than the rising candle just before it. This gives us the shape of a shape of a head and shoulders top, which can be shorted. The entry point can be set at 6909.8, and the Stop-Loss can be placed at the previous head position of 7016.8. To take profit wait until a rising candle is larger than a previous falling candle.


Where to Find Us:
Website: https://www.bybit.com
Twitter: https://www.twitter.com/Bybit_Official
Reddit: https://www.reddit.com/r/Bybit/
Youtube: https://bit.ly/2Cmuibg
Medium: https://medium.com/bybit
Facebook: https://bit.ly/2S1cyrf
Linkedin: https://bit.ly/2CxHGcz
Instagram: https://www.instagram.com/bybit_official/
Telegram: https://t.me/BybitTradingChat