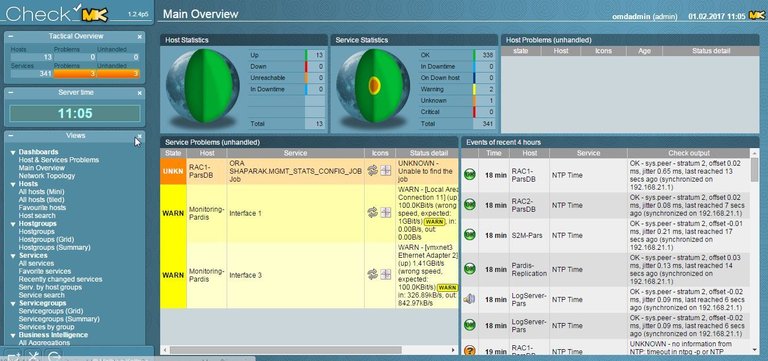
In one of my earlier posts I made a tutorial about a powerful monitoring tool called OMD(Check_MK), the installation part was pretty much clear and gave you the basics you need to monitor from your servers, now let's go deeper and see how we can get the best out of this new yet powerful tool. you can find the installation of OMD here

Host and Service Parameters
How would you make sure that your service is working properly? the first thing that I do is to make sure the process related to my server is up and running and does not use that much resources. a lot of administrators would wright some scripts to take care of this matter( which itself needs to be taken care of in case of failure), I prefer to feel my important services and to do that I add them to OMD monitoring server, this is how:
first you have to go to host and services parameters

Then search for the word 'process', you should see something like this :
(go head and select on process inventory)

At the end of the page you can find the 'create rule in folder', click on it and on the next page you can add your processes

let's go through the configuration item by item
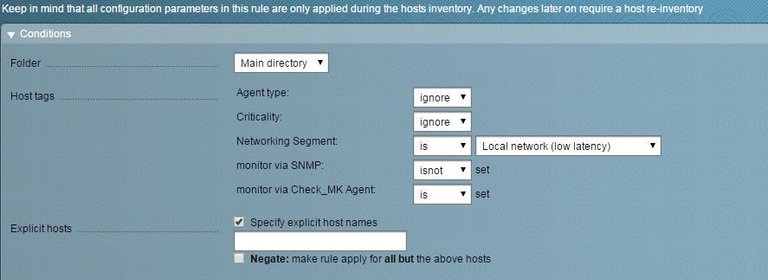
Condition
The Condition tab is for general situation of your server( Agent type:
Criticality(how important is your server, is it a test, productive, ... server)
Networking Segment(is your server in DMZ, LAN,WAN?)
monitor via SNMP(whether it is monitor via SNMP or not)
monitor via Check_MK Agent(whether it is monitor via Check_MK_agent or not)
you can specify or exclude the rule for one or some of your servers by 'explicit hosts' item

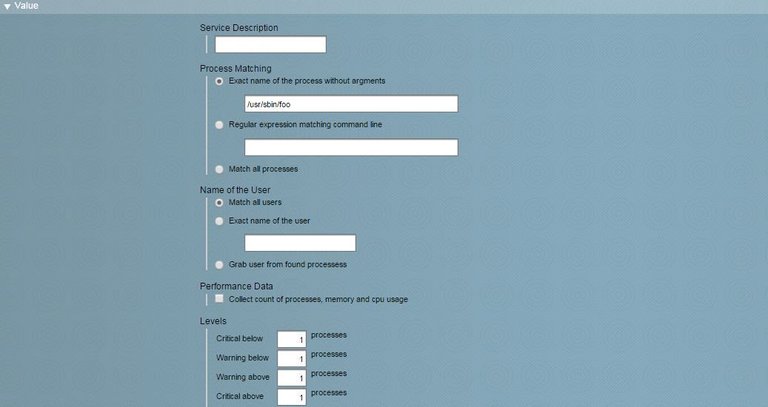
Value
Value tab is where you define your process
Service description(name of your processes that would appear on the monitoring site)
Process matching:
you have 3 options to set your process
- exact name of the process where you have to put the exact name of your process
- regular expression matching command line where every process matching your input will be counted.
- match all processes(add all processes,I don't, use it, not recommended)
in 'name of the user' you are able to specify the user that you expect your process to run with(this option is very important to me)
Performance data is an option that gives you the ability to check other aspects of your process other than just being up or down
Next options are about when to put your process in warning and critical state(CPU usage< memory usage), which helps a lot to understand whether your process is working properly on not

there is an additional options part too where you can add comments and link and documentations.
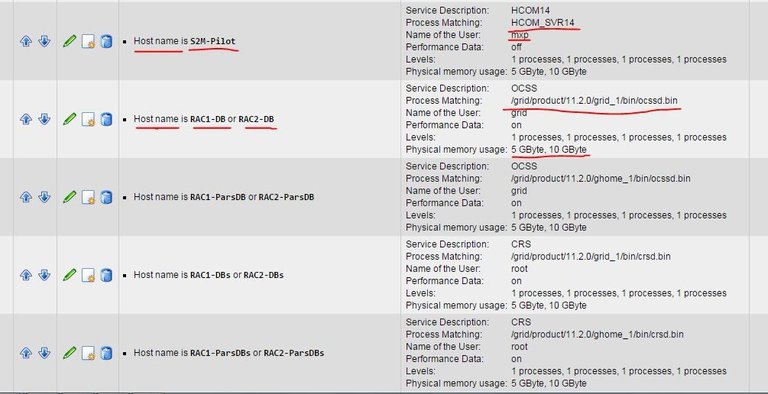
finally you will have your rules specified to your servers in a format like this:

Note that to see your proccesses on the monitoring site you must run a check inventory on the servers you intend to add the proccess monitoring.

mrpe
Another wonderful feature in check_MK or OMD is that you can add a script and monitor the output with mrpe
to use mrpe go to /usr/lib/check_mk_agent/ and create a file named mrpe(OMD is going to check this directory every 10 seconds by default and will run the scripts in it)
cd /usr/lib/check_mk_agent/plugins/
sudo touch mrpe
sudo chmod 755 mrpe
vi mrpe
now add these lines to mrpe file
#!/usr/bin/python
# -*- encoding: utf-8; py-indent-offset: 4 -*-
# +------------------------------------------------------------------+
# |             ____ _               _        __  __ _  __           |
# |            / ___| |__   ___  ___| | __   |  \/  | |/ /           |
# |           | |   | '_ \ / _ \/ __| |/ /   | |\/| | ' /            |
# |           | |___| | | |  __/ (__|   <    | |  | | . \            |
# |            \____|_| |_|\___|\___|_|\_\___|_|  |_|_|\_\           |
# |                                                                  |
# | Copyright Mathias Kettner 2014             [email protected] |
# +------------------------------------------------------------------+
#
# This file is part of Check_MK.
# The official homepage is at http://mathias-kettner.de/check_mk.
#
# check_mk is free software;  you can redistribute it and/or modify it
# under the  terms of the  GNU General Public License  as published by
# the Free Software Foundation in version 2.  check_mk is  distributed
# in the hope that it will be useful, but WITHOUT ANY WARRANTY;  with-
# out even the implied warranty of  MERCHANTABILITY  or  FITNESS FOR A
# PARTICULAR PURPOSE. See the  GNU General Public License for more de-
# ails.  You should have  received  a copy of the  GNU  General Public
# License along with GNU Make; see the file  COPYING.  If  not,  write
# to the Free Software Foundation, Inc., 51 Franklin St,  Fifth Floor,
# Boston, MA 02110-1301 USA.

def inventory_mrpe(info):
    items = []
    for line in info:
        # New Linux agent sends (check_name) in first column. Stay
        # compatible with MRPE versions not providing this info
        if line[0].startswith("("):
            item = line[1]
        else:
            item = line[0]
        items.append((item, None))
    return items


def mrpe_parse_perfdata(perfinfo):
    varname, valuetxt = perfinfo.split("=", 1)
    values = valuetxt.split(";")
    return tuple( [varname] + values)


def check_mrpe(item, params, info):
    # This check is cluster-aware. An item might be found
    # more than once. In that case we use the best of the
    # multiple statuses.

    best_state = None

    for line in info:
        if line[0].startswith("("):
            check_name = line[0][1:-1]
            line = line[1:]
        else:
            check_name = None
        if line[0] == item:
            state = int(line[1])

            # convert to original format by joining and replacing \1 back with \n
            rest = " ".join(line[2:]).replace("\1", "\n")
            # split into lines
            lines = rest.split('\n')
            # First line:  OUTPUT|PERFDATA
            parts = lines[0].split("|", 1)
            output = [parts[0].strip()]
            if state not in [ 0, 1, 2, 3]:
                output[0] = "Invalid plugin status %d. Output is: %s" % (state, output[0])
                state = 3
            if len(parts) > 1:
                perfdata = parts[1].strip().split()
            else:
                perfdata = []

            # Further lines
            now_comes_perfdata = False
            for l in lines[1:]:
                if now_comes_perfdata:
                    perfdata += l.split()
                else:
                    parts = l.split("|", 1)
                    output.append(parts[0].strip())
                    if len(parts) > 1:
                        perfdata += parts[1].strip().split()
                        now_comes_perfdata = True


            if best_state in [ None, 2 ] \
               or (state < best_state and state != 2):
                infotext = "\\n".join(output)
                perf_parsed = []
                for perfvalue in perfdata:
                    try:
                        perf_parsed.append(mrpe_parse_perfdata(perfvalue))
                    except:
                        pass

                # name of check command needed for PNP to choose the correct template
                if check_name:
                    perf_parsed.append(check_name)
            best_result = state, "\\n".join(output), perf_parsed
        best_state = state


    if best_state == None:
    return (3, "Check output not found in output of MRPE")
    else:
    return best_result


check_info["mrpe"] = {
    'check_function':          check_mrpe,
    'inventory_function':      inventory_mrpe,
    'service_description':     '%s',
    'has_perfdata':            True,
}
now create mrpe config file and locate your scripts that you want to monitor the output
sudo touch /etc/check_mk/mrpe.cfg
sudo chmod 644 /etc/check_mk/mrpe.cfg
vi /etc/check_mk/mrpe.cfg
(this is how my config file look like, first part will specify the sensor name and second part will specify the address of your script)

and this is one of my scripts that I want to monitor the output(it is crucial that my server can access a specific port on another server, and this way I check the destination port exactly from source,It helps me a lot to troubleshoot problems faster)

That's it , now you can add your processes and also monitor the output of your scripts easily, I hope you find it useful.
This post is 100% powered up
Wed Feb 1 12:50:54 IRST 2017


useful article, thumbs up :)
@kobold-djawa I am glad you liked it :)
you have a new follower and thank you for all of the upvotes
@gringalicious
thank you for the support , followed back, actually I like you posts a lot, colorful and delicious foods you got in your page :)
That is very kind, thanks so much
Nifty and powerful
@billykeed thank you :)
Very useful post! Thank you!
@oleg81
thank you for the feedback :)