With the bull’s inability to slam the door on the bears this past Monday when they had the chance, it has added a significant amount of complexity into the market structure.
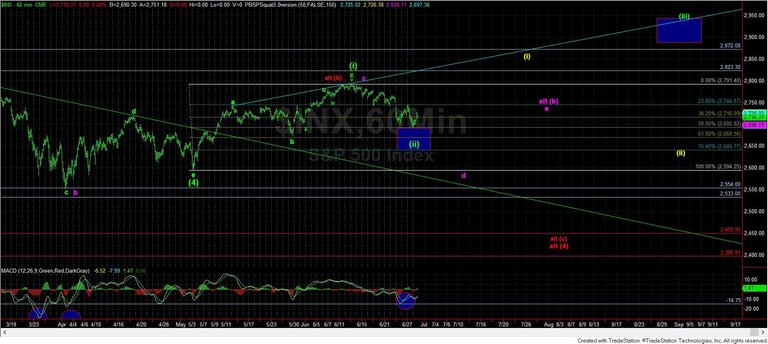
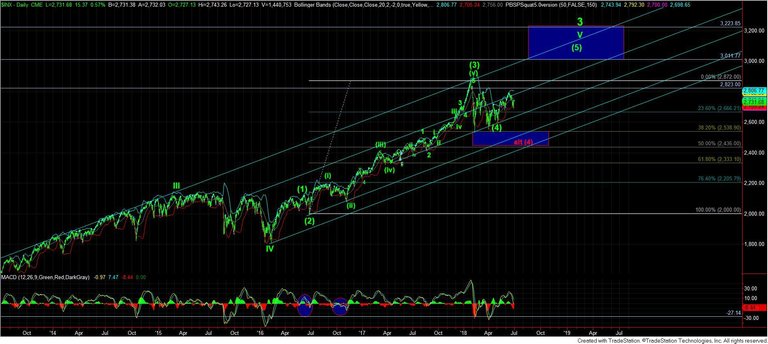
As I have been noting for some time, we have been left with a very unusual end to wave (4), and now we have a wave (5) presenting us with a lot of overlap in the SPX. While this can still mean that wave (4) is not yet complete, and we may see another leg down before we begin wave (5) in earnest, I think there are more signs pointing to the fact we are now in the throes of a wave (5), which, when completed, will usher in that 20-30% correction for which everyone seems to be expecting.
Now, due to the added complexity in the market structure, it forces me to discuss these complexities, which, unfortunately, may make this weekend update a bit more complex than you are normally used to reading. But, I will attempt to move through the progressions of the wave counts that I am tracking in a step by step fashion to make it a little easier. But, if something is not clear, please do not hesitate to ask questions below.
Where Did Wave (4) Complete?
The first questions with which we still must grapple is if the larger degree wave (4) has indeed completed, and where it completed. Assuming this past week’s low holds in the SPX, I have to maintain the assumption that the larger degree wave (4) has completed. Should we break down below this past week’s low, it certainly will open that question back up in a big way in the SPX. But, for now, I am going to work under the assumption that wave (4) has completed.
The issue then becomes where it completed. If we believe it completed at the low struck in early April, then we have a very unusual c-wave within that wave (4) which is significantly smaller than the a-wave, especially in the SPX. This is a highly unusual a-b-c structure, which is why we have been leaning towards the triangle, which, itself, has issues of proportionality. This is why I have reiterated many times that the lack of a clear and proportional c-wave within a correction makes it much more complex to determine when that correction indeed completed.
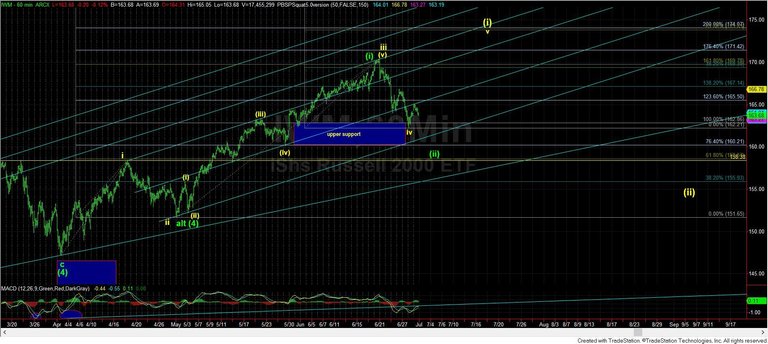
I am going to use the attached 60-minute IWM chart to illustrate the issue a bit more clearly regarding why it is so important to have a clear conclusion to wave (4). The reason I am using the IWM is because it has an impulsive wave structure with which we can work a bit more cleanly.
As you can see, the proposed low for wave (4) in early April came up ever so slightly short of my minimal target at the point where c=.764*a, as highlighted by the blue box I set on the chart as a target for wave (4). So, my initial expectation was that this concluded wave (4) in a truncated form in the IWM.
With that in mind, the count would lean towards the pullback seen this past week only being wave iv of wave (i), as presented in yellow. In fact, it would provide us with an almost textbook Fibonacci Pinball structure, wherein the wave (iii) of iii struck the 1.00 extension, pulled back to find support at the .764 extension for wave (iv) of iiii, and then rallied to the 1.618 extension for wave (v) of iii. Since then, we have pulled back to the .382 retracement of wave iii, which coincides with the 1.00 extension of waves i and ii, which is the typical retracement for wave iv in our Fibonacci Pinball structure.
Assuming we would rally for another 5-wave structure in the IWM to a higher high, it would add support that the leading diagonal count for wave (i) in the SPX being followed by Zac Mannes, our lead Stockwaves analyst at Elliottwavetrader.net, is a strong contender to be the primary count. That would suggest that we see one more rally over 2800SPX, followed by a larger degree wave (ii) pullback into the end of the summer.
(I would still rather not see any rally top out at 2823SPX, for if it did, I would have to consider that wave (4) may not have concluded in the SPX, and a c-wave down was going to be seen in the SPX, whereas the IWM would “outperform,” and only see a wave (ii) retracement.)
Alternatively, if we were to apply the same triangle count in the IWM that we did in the SPX, that would suggest we have completed 5 waves up off early May low in the IWM, and that this pullback has been a wave (ii), shown as the green counts in the IWM and SPX. Whereas the IWM displayed a standard impulsive structure for wave (i), the SPX had that same wave (i) subdivide as an a-b-c structure, as that is how ending diagonals take shape.
From a practical stand point, this would mean that if the market can muster another rally from this region, as long as the IWM remains below the 174 region, which represents the 2.00 extension of waves i and ii, as well as the region where wave v and i would be just about equal, then I would have to view the yellow count as operative, and expect a month to two month long pullback into the end of the summer for a wave (ii). Again, this would also support the leading diagonal that Zac has been tracking. Moreover, a significant number of the individual stocks that he is following also support this as the operative count.
Alternatively, should the IWM be able to exceed the .764 extension of green waves (i) and (ii) at 176.50, it makes it highly likely that we are already in the 3rd wave of wave (5), which means we are in wave (iii) of the ending diagonal in the SPX. But, it also would suggest that the IWM is in the heart of a melt-up phase, with a standard target for wave (iii) between 188-192.
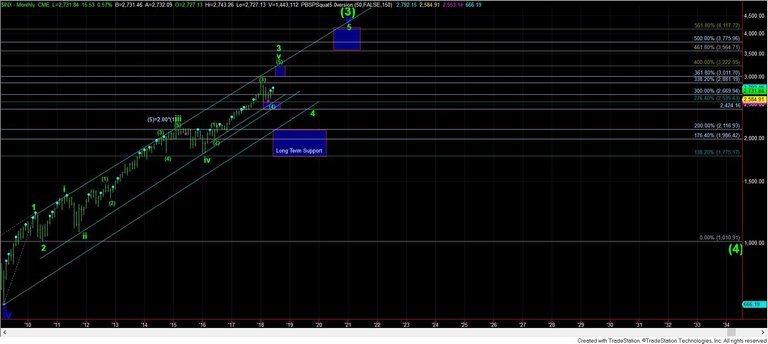
Lastly, if the yellow count does become the operative count, then it would suggest that wave (ii) can be quite deep in the SPX, which is typical of second waves after the completion of a leading diagonal first wave. Moreover, it would also strongly suggest that we will attain our higher targets in the 3225SPX region sometime between the end of the 1st and end of the 2nd quarter of 2019.
However, should we already be in wave (iii), then it becomes more likely that we will complete wave (5) in 2018, and we may not see much more extension beyond the 3011 region. But, if this does turn out to be an ending diagonal for wave (5) in the SPX, the one positive thing is that we can prepare for a VERY strong reversal once it is nearing completion. And, that reversal will likely take us back down to the 2500 region VERY quickly from the 3000 region, which will likely only be the a-wave of the larger degree wave 4, which should ultimately be a 20-30% correction.
In summary, the market has still not made it clear how it wants to rally up to 3000SPX. It still has two bullish potential paths, which I outlined above, while leaving the door open in the SPX for that red c-wave down for a larger degree wave (4). My primary count still has wave (4) completed, but it seems more reasonable to assume it has a higher probability of completion in the IWM than in the SPX at this time. And, how the market resolves this region over the coming few weeks will give us much more insight as to whether wave (5) can top in 2018 closer to the 3000 region, or if we can extend this rally into the middle of 2019, and the 3225SPX region before we begin the 20-30% correction we expect for 2019.


