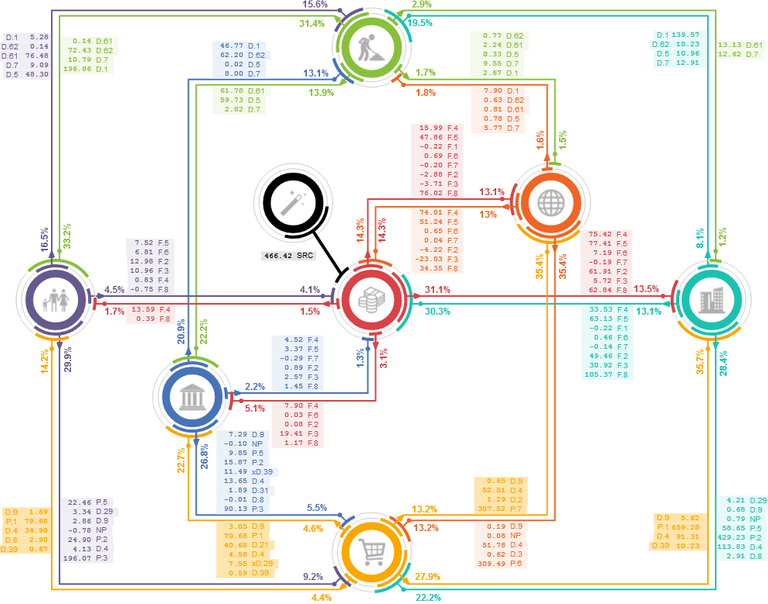
On the diagram you can see the summations of all the amounts that flowed from and to the different entities trough the markets during 1 year (2011) inside 1 country (Belgium), all numbers are x billion EUR (source: https://ec.europa.eu/eurostat).
![]()
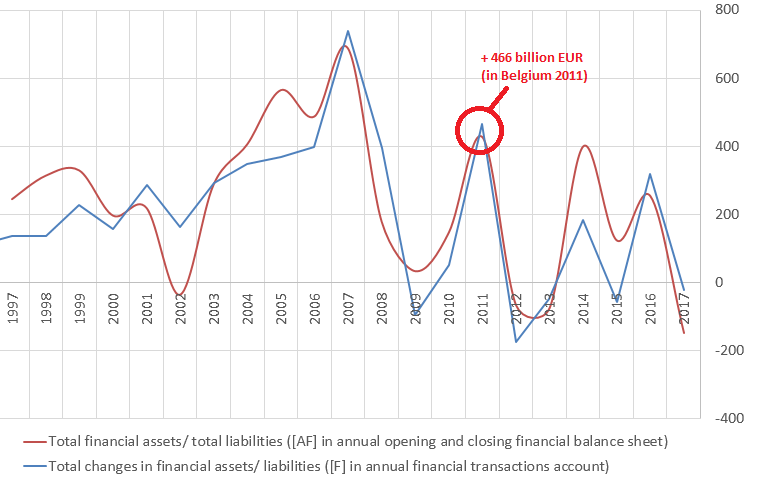
- increase of 466.42 billion EUR)On the diagram you can see the total sum of all the increases and decreases for the entire year in the grey SRC label
 (in this case for Belgium in 2011 there was a net
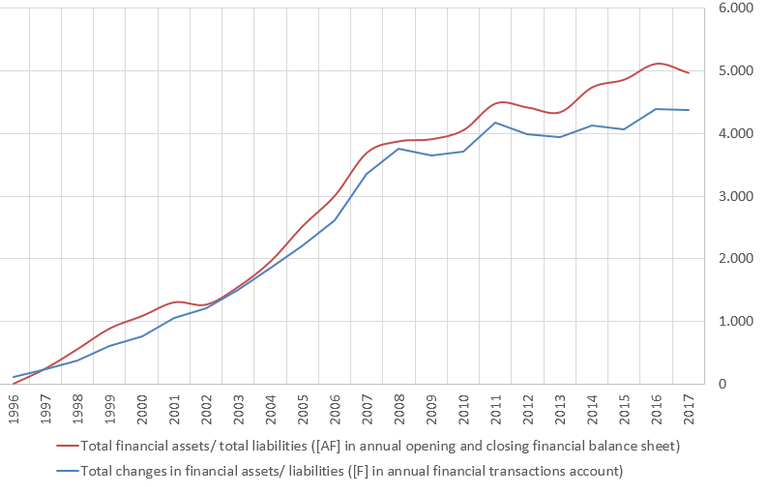
On average more money is created then paid off, this means the money supply is increasing forever.
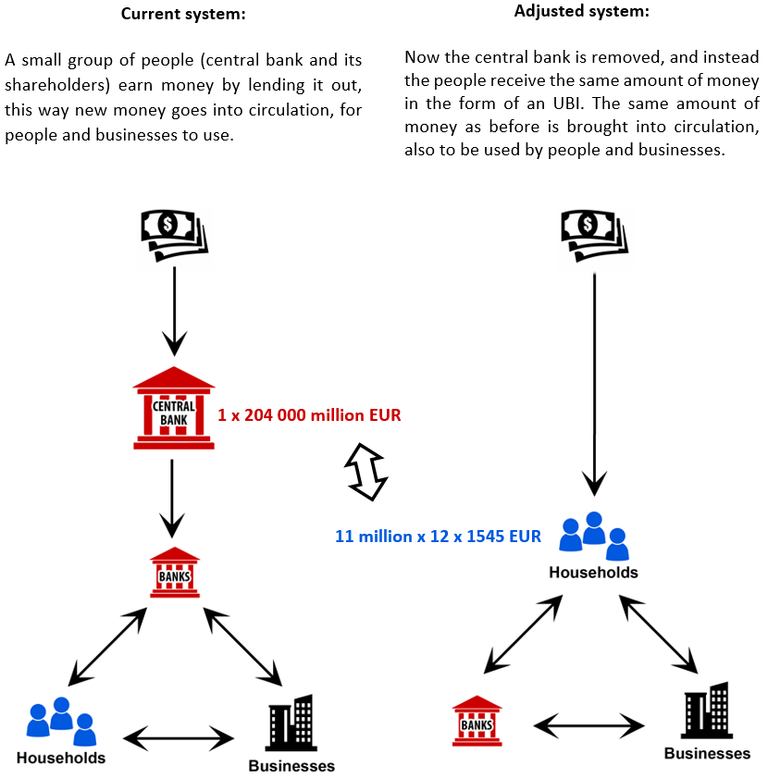
In both cases the same amount of money is brought into circulation (in the example this is about 204 billion EUR in the 1 year 2011). And in both cases it ends up in the banks and/or into circulation.
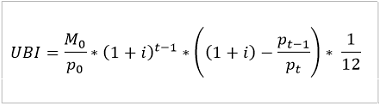
- M0 = the amount of EUR in circulation at a certain time t0 (year 0)
- p0 = the size of the population at time t0 (year 0)
- M1, M2, … ,Mt are the amounts a time 1, 2, …, t (for example at year 1, year 2 etc)
- p1, p2, … ,pt is the population size at time 1, 2, …, t (for example at year 1, year 2 etc)
- i = 0.03 = the increase of the total amount of money in circulation per person
Congratulations @tomtem! You have completed the following achievement on the Steem blockchain and have been rewarded with new badge(s) :
You can view your badges on your Steem Board and compare to others on the Steem Ranking
If you no longer want to receive notifications, reply to this comment with the word
STOPVote for @Steemitboard as a witness to get one more award and increased upvotes!
Congratulations @tomtem! You received a personal award!
You can view your badges on your Steem Board and compare to others on the Steem Ranking
Vote for @Steemitboard as a witness to get one more award and increased upvotes!