
The crypto community eagerly awaits more details on Facebook’s crypto coin, dubbed Libra, which is likely to be unveiled on Tuesday.
Will this be the catalyst that will drive mass adoption of digital currencies and give legitimacy to space? Many crypto investors certainly think so. With the massive retail reach of Facebook, it does offer a great opportunity to the public to foray into the world of cryptos.
If Facebook’s crypto project turns out to be a success, it will compel the other financial institutions to jump in with their own services. The institutional investors who have largely been absent will be forced to diversify their portfolio using cryptocurrencies or risk being left behind. This is also likely to turn the attention of the investors to the existing projects that have solid use cases.
Additionally, the ongoing trade war between the US and China has reconfirmed cryptocurrencies as a safe haven bet. Research by Grayscale Investments shows that Bitcoin can act as a hedge during a global liquidity crisis due to its distinct set of properties. Let’s analyse the top five cryptocurrencies and see if we spot any buying opportunities.
LEARN HOW TO TRADE CRYPTOCURRENCY WITH A MASTER CRYPTO TRADER!
BTC/USD
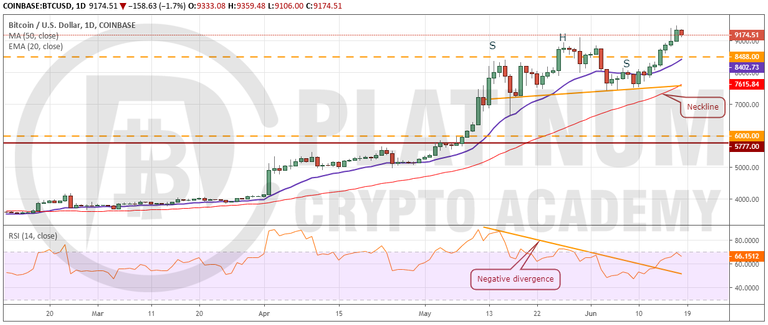
Bitcoin scaled above the head of the head and shoulders (H&S) pattern on June 16. This invalidated the bearish setup. Similarly, the negative divergence on the RSI has also been negated. Both the moving averages are trending up and the RSI is close to the overbought zone, which suggests that the bulls are in command. The next target to watch on the upside is $10,000.
We anticipate a stiff resistance close to $10,000. But the current rally from the lows has surprised us by easily breaking out of stiff resistance. Hence, if the momentum carries the leading cryptocurrency above $10,000, the rally can extend to $11,775.
Contrary to our expectation, if the pair fails to ascend $10,000, it can fall to $8,488. This is strong support as the 20-day EMA is also located at this level. However, if this support breaks, the next stop is the 50-day SMA. The trend will turn negative if the price stays below $7,427.
ETH/USD
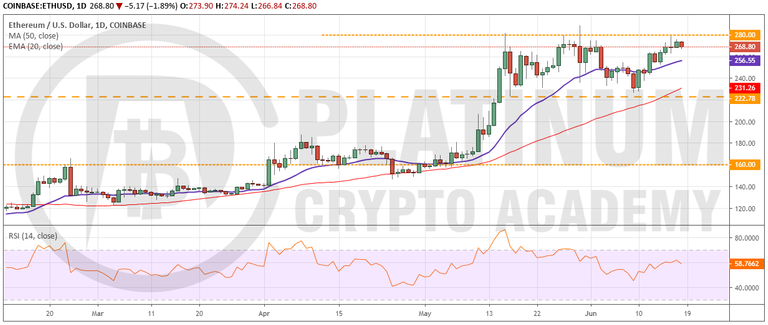
Ethereum is currently near the top of $222.78 to $280 range. The 20-day EMA has turned up once again and the RSI is in the positive territory, which suggests that bulls have the upper hand. If the price breaks out and closes (UTC time) above the range, it can move up to $322.16.
On the other hand, if the bears defend the resistance at $280, the digital currency might dip to the 20-day EMA, below which it can drop to the 50-day SMA. It will turn negative only on a breakdown and close (UTC time) below the critical support of $222.78.
Short-term traders can buy the breakout and close above $280 for a quick momentum trade. However, as the target objective is not large, a close stop loss can be used.
XRP/USD
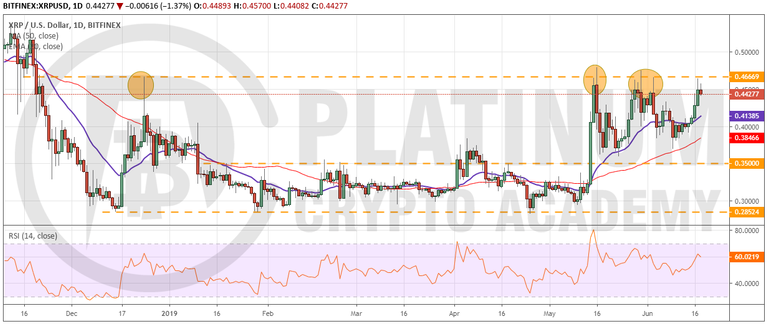
XRP took support at the 50-day SMA and has risen close to the overhead resistance of $0.46669, which had previously acted as a stiff resistance. The 20-day EMA has started to turn up once again and the RSI is in the positive zone. This suggests that the bulls are in command.
If the bulls push the price above $0.46669, the digital currency is likely to pick up momentum and rally to $0.6270. It might face some resistance at $0.53127 and $0.570 but we expect these levels to be scaled.
Traders, who are long on our earlier recommendation can book profits on 50% of positions if the bulls struggle to scale above $0.46669. The rest of the positions can be held with the stop loss just below the 50-day SMA. The stops can thereafter be tightened further by trailing just below the 20-day EMA if the cryptocurrency breaks out and rallies closer to $0.53.
Our bullish view will be invalidated if the price reverses direction from the current levels and breaks down of both the moving averages. The trend will turn negative on a breakdown of $0.350.
LTC/USD
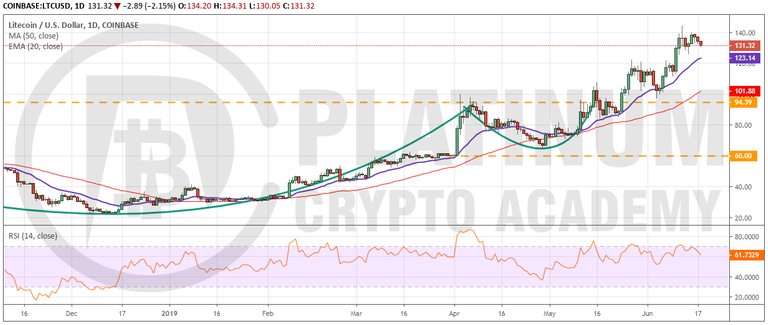
Litecoin is facing resistance close to $140 mark. Traders who had trailed their stop loss just below the previous day’s low–according to our recommendation given in the previous analysis–would have closed 50% of their position near $130. The remaining position can be held with the stop loss placed just below the 20-day EMA.
Both the moving averages are trending up and the RSI is in the positive territory, which shows that the bulls are at an advantage. If they can push the price above $144.34, a rally to $166.61 is probable.
Conversely, if the bears sink the price below the 20-day EMA, a drop to the 50-day SMA is likely. If this level also cracks, the slide will retest the critical support at $94.39, below which the trend will turn negative.
BCH/USD
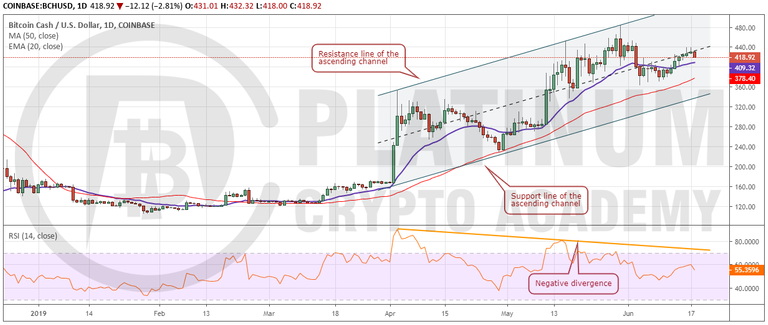
Bitcoin Cash broke out of the 20-day EMA on June 13 and has been moving up gradually since then. However, the up-move lacks conviction. It will face resistance close to $452.75. But if the bulls succeed in breaking out of this level, the rally can extend to $483.33. If the momentum picks up, a move to the resistance line of the ascending channel is also possible.
On the contrary, if the price turns down from either of the overhead resistance levels and plummets below the 20-day EMA, it will lose momentum. We anticipate buyers to step in between the support line of the ascending channel and the 50-day SMA. If the price rebounds from this support zone, we might suggest a long position. But if the support zone breaks down, the trend will turn negative.
LEARN HOW TO TRADE CRYPTOCURRENCY WITH A MASTER CRYPTO TRADER!
If you’ve booked your session above, we look forward to speaking to you soon!
Hopefully, you have enjoyed today’s article. Thanks for reading!
Have a fantastic day!
Live from the Platinum Crypto Trading Floor.