Repository
https://github.com/steemit/steem
The aim of this analysis is to get an idea about the upvoting behavior of different Steem applications for the last six months. I chose the applications that I think are the most popular among Steem users like @steemhunt, @actifit, @partiko, @busy, @esteemapp, @fundition, @steempress-io, @dtube, and @dsound. Along with the number of upvotes each application gave to its users, you will find some interesting information about their upvoting behavior like the number of upvotes given on posts and comments, average and standard deviations of upvotes, monthwise, daywise and hourwise performance and the distribution of upvotes for each application
Data Collection
All the data was extracted from Steem SQL Database (Paid subscription service held and managed by @arcange). The data was taken from 1-01-2019 to 06-30-2019 and all the calculations were made on Power BI using DAX. SQL query that was used to extract the data can be found at the end of this post.
Total Number of Upvotes on Posts & Comments
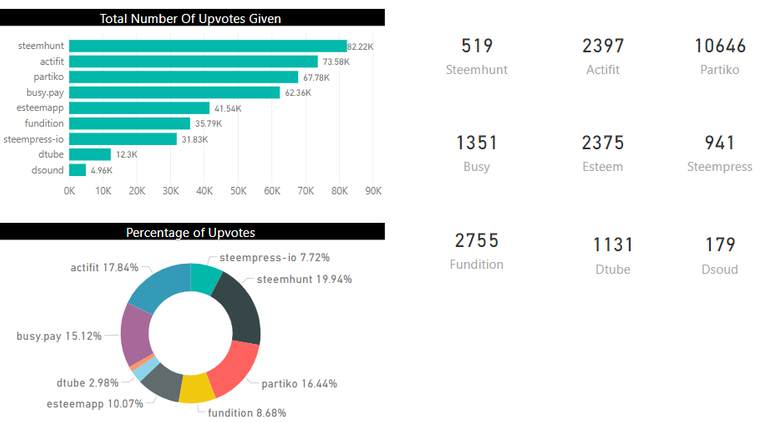
@steemhunt has the highest percentage when we compare the number of upvotes given with other Steem applications, however, the unique number of authors who were given upvotes by @steemhunt were only 519. @dtube and @dsound tend to be at the bottom when it comes to the number of upvotes given compared with other Steem applications. On the right side of the image, you can see the number of unique users who were given upvotes by each application. Another interesting thing would be to calculate the number of unique user ratio who were given upvotes by each application.

@partiko is on top when it comes to unique user ratio (Giving an upvote to a unique user). Though @steemhunt is on top with the number of upvotes given, however, at the same time, it has the lowest unique user ratio. @dtube and @dsound gave the lowest number of upvotes, but @dtube's unique user ratio is far better than @dsound.
Let's separate the number of upvotes given on comments and posts.

Interesting!
You can see that @steemhunt and @fundition were the only applications that gave a fair amount of upvotes on comments with a percentage of 78% and 9.32% respectively. Did a little research and found that @steemhunt rewards those users as well who comment on @steemhunt posts which is a great idea to increase the engagement rate.
So my next question is, what's the engagement rate for each application? (Comments on posts)
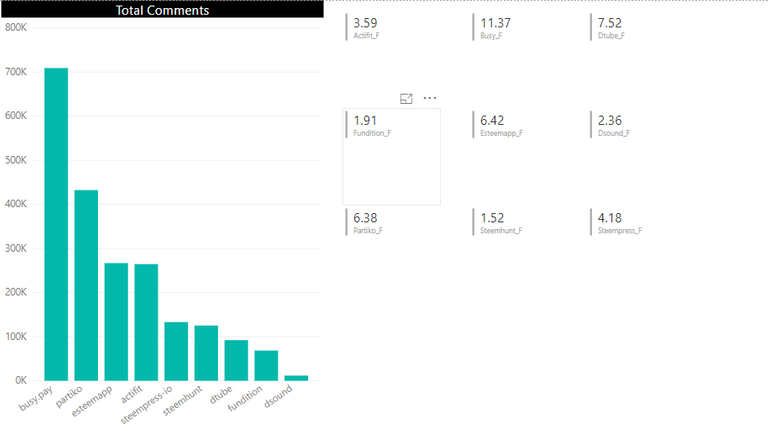
@busy and @dtube have the highest engagement rates with 11.37 and 7.52 comments per post respectively. Surprisingly, @steemhunt's engagement rate is at the bottom with 1.52 comments per post.
Average and Standard Deviations
@dsound and @dtube have the highest averages, though the number of upvotes they gave was quite low, their average upvote weight is quite outstanding. On the other hand, @dsound has the highest standard deviation that means that their upvote weight had a greater variation compared to others. @steemhunt has the lowest average upvote weight and @busy has the lowest standard deviation.
Did you notice @partiko? Their average upvote weight is 2.48 but the standard deviation is 11.74 which is quite high.
Monthly Upvote Analysis
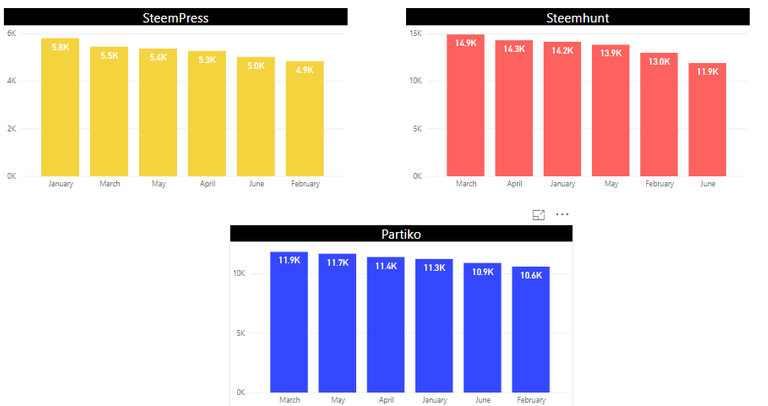
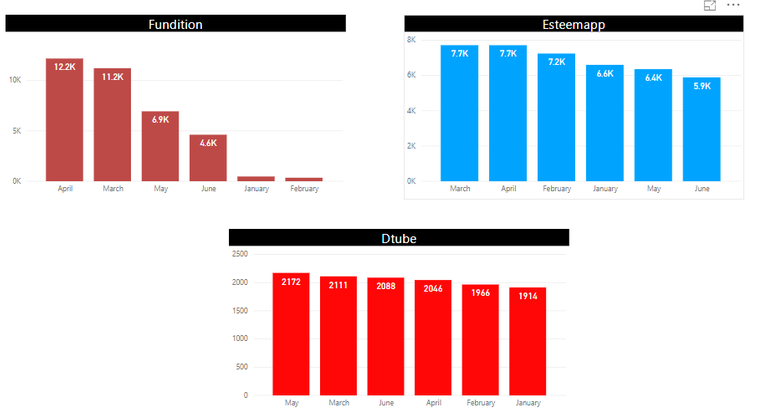
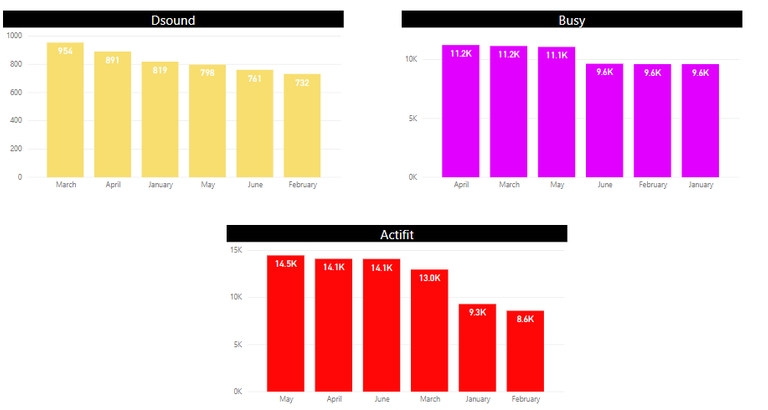
Here, you can see the upvotes given by each application from January to June.
Daily Upvote Analysis
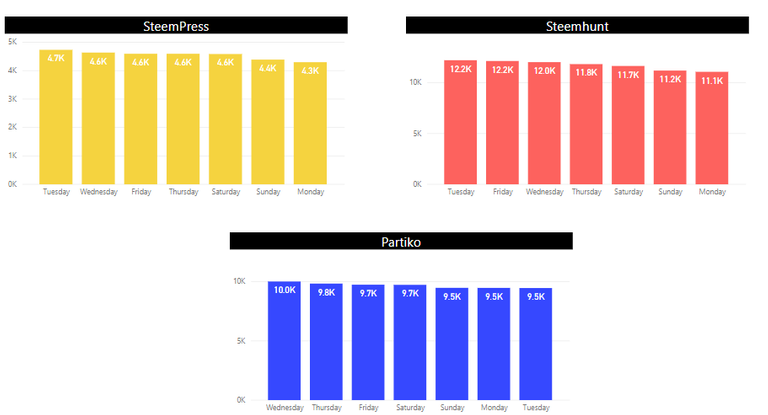
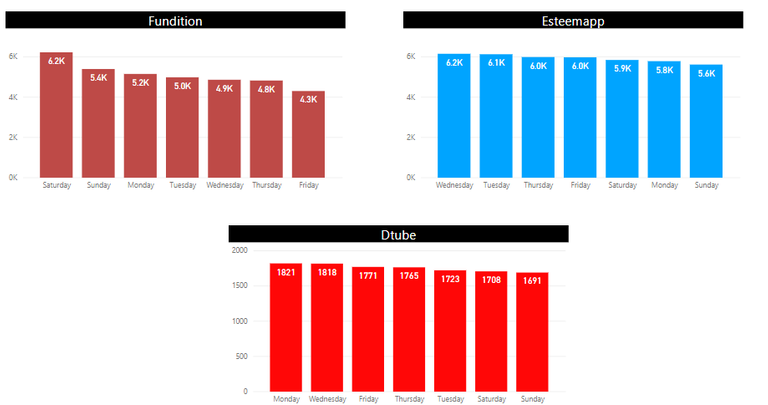
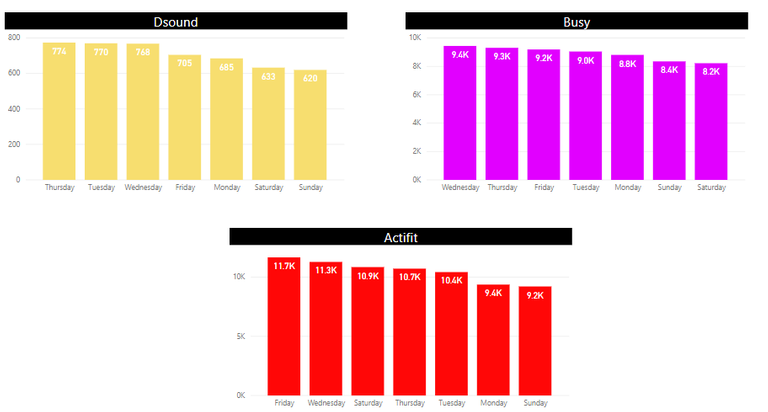
What day of the week each application gave the most upvotes?
Hourly Upvote Analysis
And at what hour most upvotes were given by these applications?
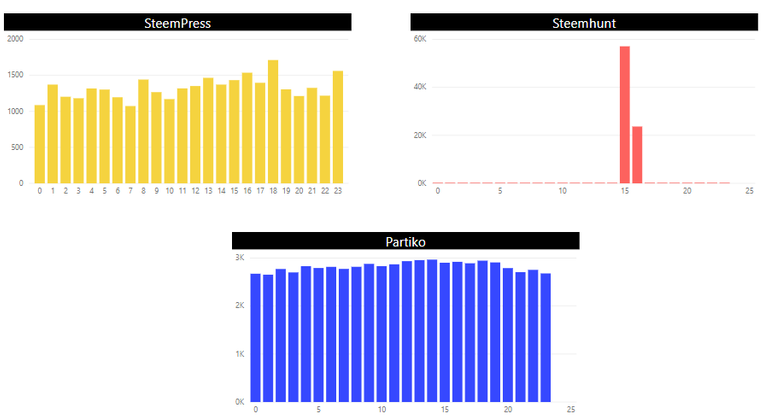
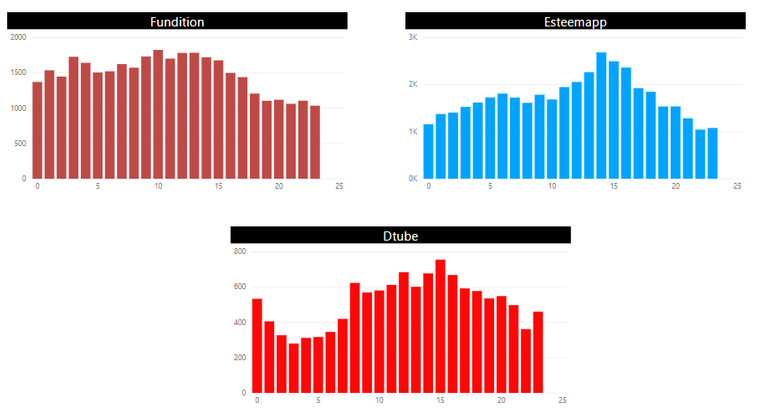
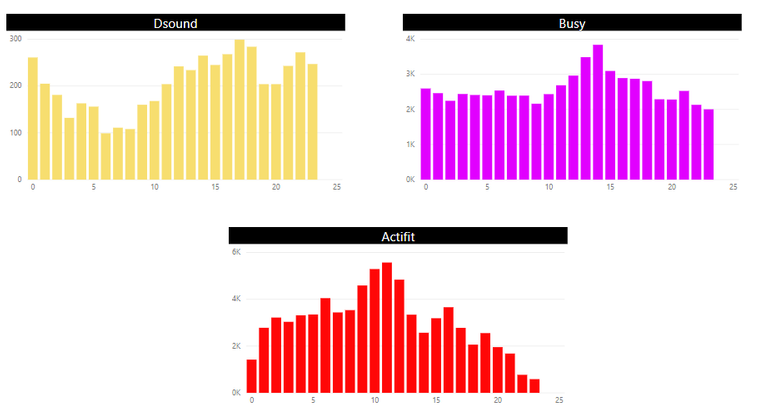
Dod you notice something weird? @steemhunt almost gave every upvote between 3:00 PM to 500 PM.
Distribution of Upvotes
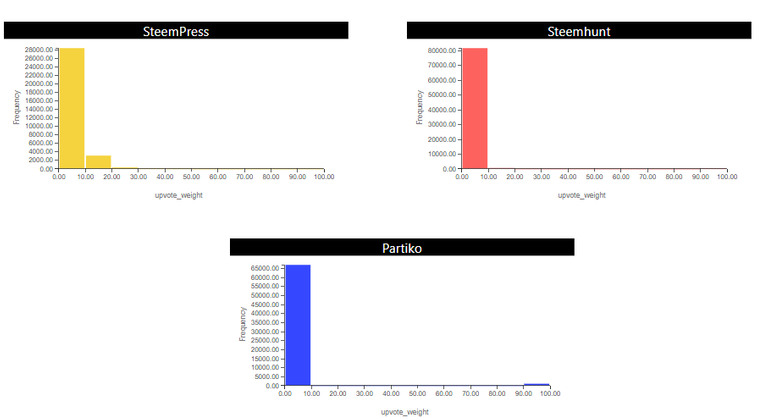
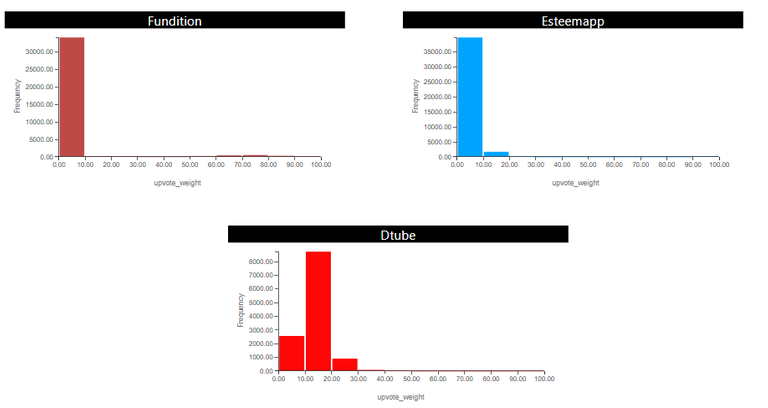
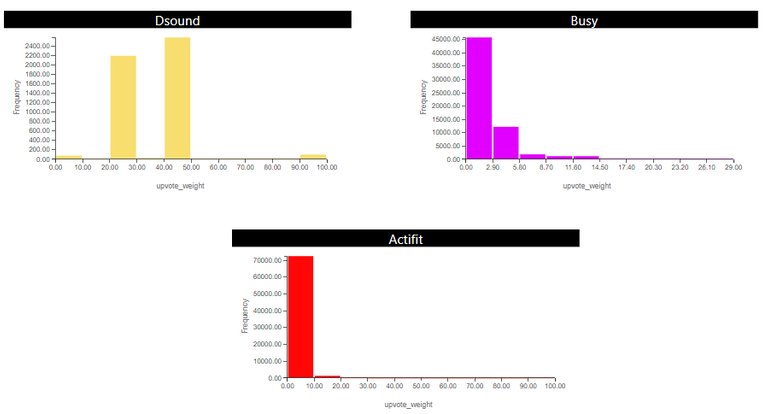
You can see that the upvote weight for most of the application lies between 0 - 10, however, @dtube and @dsound did different from all other applications and we can see a few tall bars for other ranges as well. The weight of most of the upvotes that @busy gave was between 0 - 2.9.
Relationship Between Comments & Upvotes
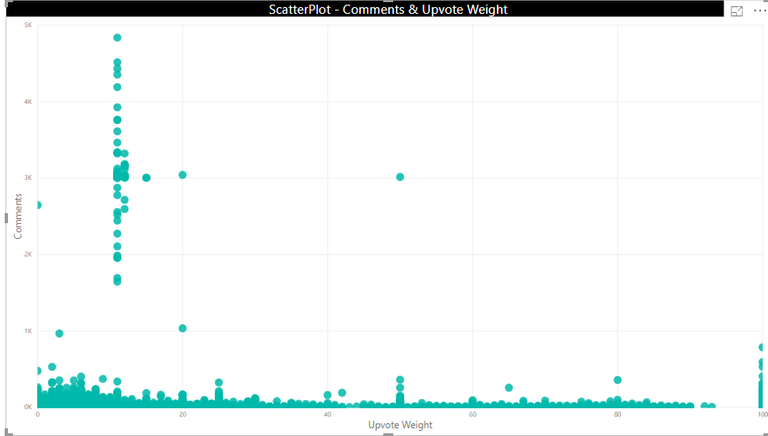
I wanted to see if there is any correlation between the upvote weight and comments but there was none. The coefficient of correlation is 0.0384 between the upvote weight and comments.
Conclusion
Steem applications play a vital role in attracting the outside world towards this platform, so their upvoting behavior is crucial for the success of this platform. From the above analysis, we can see that a lot of applications are giving a fair amount of upvotes to its users with a low upvote weight which I think is a perfect way to attract new users, however, the unique user ratio should be improved in order to spread the number of upvotes to more users.
SQL Query
SELECT
TxVotes.ID,
TxVotes.voter,
TxVotes.author,
CAST(TxVotes."weight" AS INT)/100 AS upvote_weight,
TxVotes."timestamp",
CASE
WHEN Comments.depth = 0 THEN 'Post'
ELSE 'Comment'
END AS post_type,
Comments.depth,
Comments.url,
Comments.children AS comments
FROM TxVotes
JOIN Comments
ON TxVotes.permlink = Comments.permlink AND Txvotes.author = Comments.author
WHERE TxVotes.voter IN ('dtube', 'dsound', 'esteemapp', 'busy.pay', 'steempress-io', 'steemhunt', 'fundition', 'actifit','partiko')
AND TXVotes."timestamp" Between '2019-01-01' AND '2019-06-30'
.
Thank you for your review, @crokkon! Keep up the good work!
Hi @a-data-scientist, welcome to Steem and we're glad your first post is an Utopian analysis contribution. Great start! :)
Thanks :)
I'm surprised to see steemhunt that low in your engagement metric - how did you calculate the numbers? I think only the number of children to root posts should go in this metric, otherwise this would be biased by voted comments with no further replies.
I counted all the comments that were made on the posts upvoted by Steemhunt and then divided it to the total number of posts.
Steemhunt is also special in a way that it ranks all posts/comments from a period of 24h and then starts a voting round. This is why you found most of their votes at around the same time of the day.
Now I got it!
The daily/monthly upvote graphs per app are a bit hard to compare since the bins are ordered by value instead of all by day/month.
Yes, this is what I realized too after posting this analysis, will take care of it next time.
Looking forward to more analyses from you! :D
Thanks a lot, @crokkon :)
Hey, @a-data-scientist!
Thanks for contributing on Utopian.
We’re already looking forward to your next contribution!
Get higher incentives and support Utopian.io!
Simply set @utopian.pay as a 5% (or higher) payout beneficiary on your contribution post (via SteemPlus or Steeditor).
Want to chat? Join us on Discord https://discord.gg/h52nFrV.
Vote for Utopian Witness!
Thanks for mentioning eSteem app. Kindly join our Discord or Telegram channel for more benefits and offers on eSteem, don't miss our amazing updates.
Follow @esteemapp as well!
Congratulations @a-data-scientist! You have completed the following achievement on the Steem blockchain and have been rewarded with new badge(s) :
You can view your badges on your Steem Board and compare to others on the Steem Ranking
If you no longer want to receive notifications, reply to this comment with the word
STOPVote for @Steemitboard as a witness to get one more award and increased upvotes!
Hi @a-data-scientist!
Your post was upvoted by @steem-ua, new Steem dApp, using UserAuthority for algorithmic post curation!
Your post is eligible for our upvote, thanks to our collaboration with @utopian-io!
Feel free to join our @steem-ua Discord server
Congratulations @a-data-scientist! You received a personal award!
You can view your badges on your Steem Board and compare to others on the Steem Ranking
Do not miss the last post from @steemitboard:
Vote for @Steemitboard as a witness to get one more award and increased upvotes!