Repository
https://github.com/yashwanth2804/Spark-IMDB-Graph
What Will I Learn?
- You will learn about graphs and graph algorithms
- You will learn how to use the Databricks cloud notebook
Requirements
- A laptop or pc which has an internet connection
Difficulty
- Intermediate
Tutorial Contents
Graph Analytics on IMDB Top 250 movies - Part 2
Tutorial structure
- Graphs and Graphs Algorithms
1.1 Graphs
1.2 Algorithms
1.2.1 Breadth-first search (BFS)
1.2.2 Connected components
1.2.3 Label propagation
1.2.4 PageRank
1.2.5 Shortest paths
1.2.6 Triangle counting - DATABRICKS
2.1 Creating an account
2.2 Spinning up a new cluster
2.3 Creating a new notebook
2.4 Uploading a file to a cloud
2.5 Loading a CSV file
2.6 Exploring Spark-UI
2.7 Display Html in a notebook
1.Graphs and Graphs Algorithms
1.1 Graphs
Graphs are also treated as "Networks" / "Relations" in computer terminology.The main abstraction of the Graph is node and edge .If you think in terms of social connections, peoples are nodes and their relations are edges. In the case of flights scenario, nodes will be airports and flights will be edges.Sometimes nodes also known as vertex and edges as links.
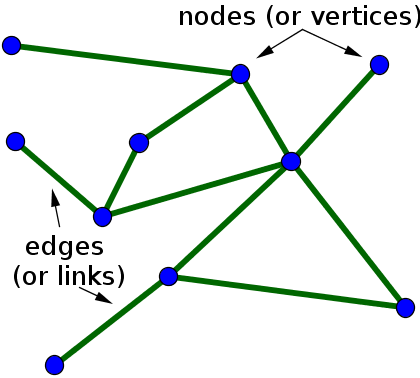
Fig: Edges and links of the graph
A distinction is made between undirected graphs, where edges link two vertices symmetrically, and directed graphs, where edges, then called arrows, link two vertices asymmetrically. In our Graph analytics further, we are employing only undirected graphs, means if actor1 knows actor2 then actor2 also knows actor1.
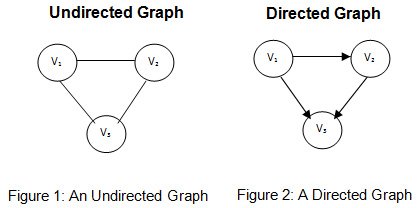
fig: Directed and undirected graphs
1.2 Alogithms
Though there are many graph algorithms exists but in spark (graphframe library) there only a few notable implementations.
1.2.1 Breadth-first search (BFS)
Breadth-first-search/Traversal is a graph traversal algorithm that starts traversing the graph from the root node and explores all the neighboring nodes(Vertex). Then, it selects the nearest node and explores all the unexplored nodes. The algorithm follows the same process for each of the nearest node until it finds the goal.
Real world use case, BFS runs on the map above and determines what the shortest routes between the cities are and produces the map below, which shows the best paths from city to city.
1.2.2 Connected components
A connected component of a graph is a subgraph in which any two vertices are connected to each other by one or more edges, and which is connected to no additional vertices in the supergraph. In the (undirected) example below there are two connected components. Connected components detection can be interesting for clustering, but also to make your computations more efficient
Use case
As you can see below the graph is a comic book network,on which we built a graph which shows that all Marvel characters are connected/strongly-connected in the network. On the contrary, DC characters have also not been involved with any of Marvel characters.
The graph below represents the comic book graph
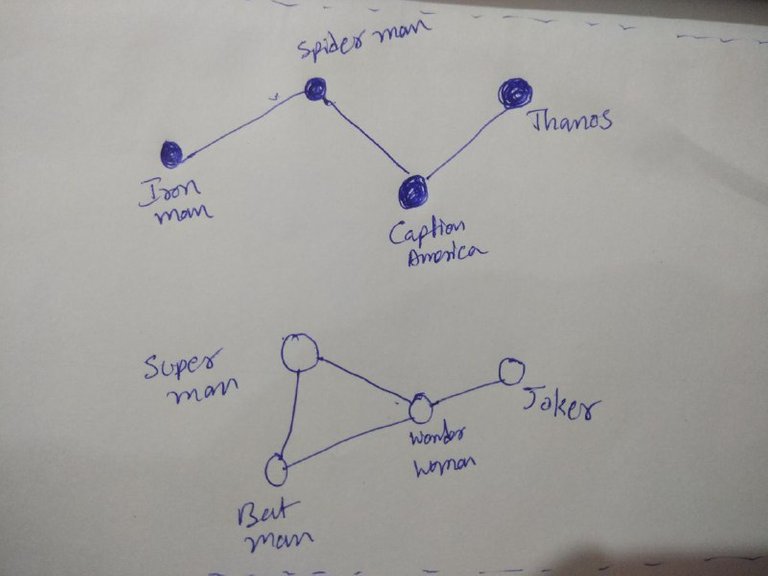
fig: Showing connected two components in a given comic book network
1.2.3 Label propagation
The Label Propagation algorithm (LPA) is a fast algorithm for finding communities in a graph. It detects these communities using network structure alone as its guide and doesn’t require a pre-defined objective function or prior information about the communities.
Use case
Label propagation has been used to estimate potentially dangerous combinations of drugs to co-prescribe to a patient, based on the chemical similarity and side effect profiles.
you can find more about here Label propagation
1.2.4 PageRank
PageRank is an algorithm that measures the connectivity of nodes.
It can be computed by either iteratively distributing one node’s rank (originally based on degree) over its neighbors or by randomly traversing the graph and counting the frequency of hitting each node during these walks.
Use case
Personalized PageRank is used by Twitter to present users with recommendations of other accounts that they may wish to follow. The algorithm is run over a graph which contains shared interests and common connections.
1.2.5 Shortest paths
The Shortest Path algorithm calculates the shortest (weighted) path between a pair of nodes. In this category, Dijkstra’s algorithm is the most well known. It is a real-time graph algorithm and can be used as part of the normal user flow in a web or mobile application. The shortest path employs BFS to find single-source shortest paths.
Use case
Social networks can use the algorithm to find the degrees of separation between people. For example, when you view someone’s profile on LinkedIn, it will indicate how many people separate you in the connections graph, as well as listing your mutual connections.
1.2.6 Triangle counting
Triangle counting is a community detection graph algorithm that is used to determine the number of triangles passing through each node in the graph. A triangle is a set of three nodes, where each node has a relationship to all other nodes.
Use case
Triangle count and clustering coefficient have been shown to be useful as features for classifying a given website as spam, or non-spam.
2. DataBricks
A DataBricks notebook is a web-based interface to a document that contains runnable code, visualizations, and narrative text. Notebooks are one interface for interacting with Databricks. It is similar to jupyter, zeppelin notebooks. It supports R, Python, Scala
languages.
Why I choose Databricks, while Jupyter and zeeplin are available, because you can get free 6GB ram instance in a community edition and saves you from local installations and configuration. Just plug and play for this tutorial purpose.
2.1 Creating an account
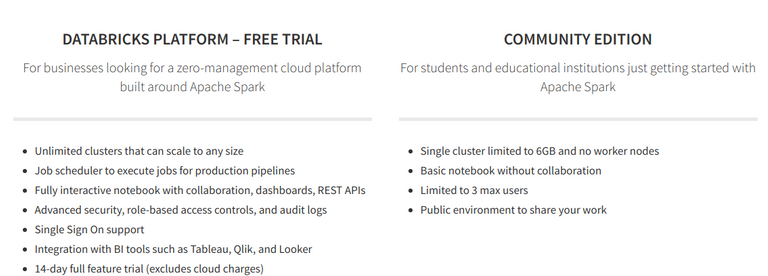
fig: showing DataBricks trail and community editions
Head to Community edition and create an account you can also try out a free trial version for 14 days. Once you login you will be landed to the home page

fig: Home page of Databricks community edition
2.2 Spinning up a new cluster
On the left side panel click Cluster icon which launches cluster configuration page.Create Cluster button will launch a cluster for you.
just name your cluster and leave the rest as it is.
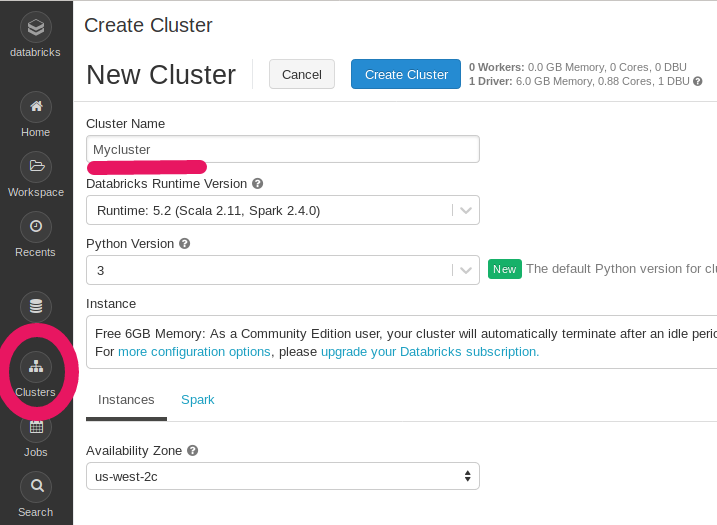
Fig: Cluster page in data bricks
2.3 Creating a new notebook
On the left side panel click
Work space icon -> users -> <your username> -> right click -> create -> notebook
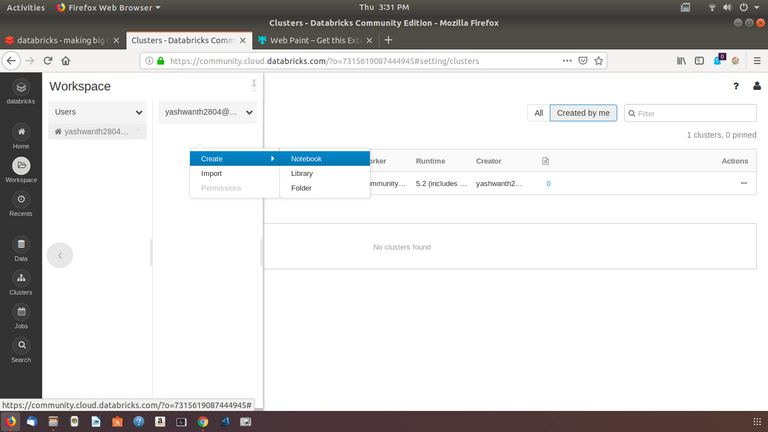
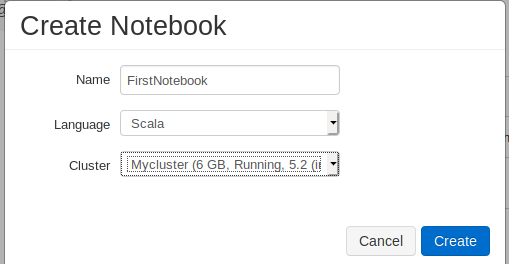
Fig: creating a notebook page in Databricks
Check the notebook
You can enter text in the editable area of the cell[each box referred to as cell]. Just for sake of testing whether our notebook connected to the cluster or not, type sc which should return a sparkContex object as below
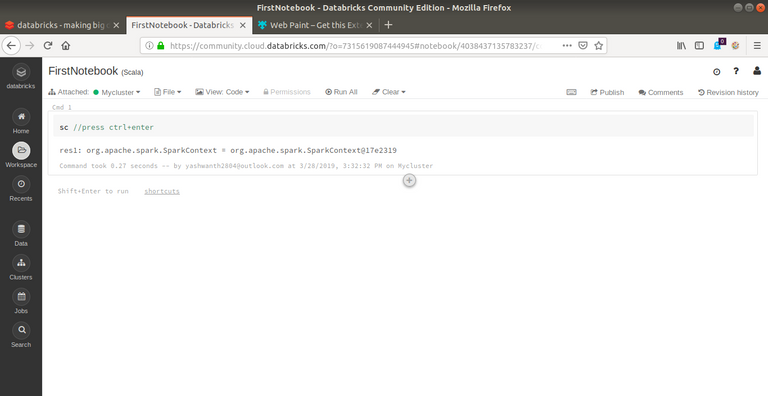
2.4 Uploading a file to cloud
There are many options for the file upload, which are typical file upload, S3, DBFS. We can upload local files by clicking browse option.
Download sample csv here
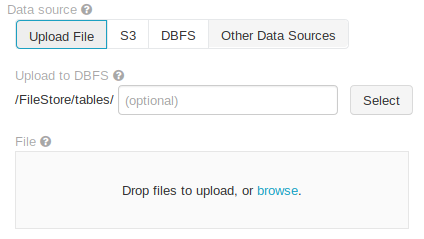
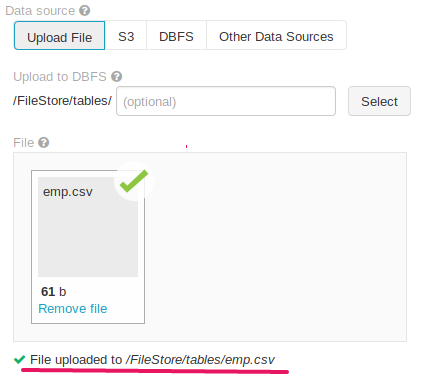
Fig: File uploader page in Databricks notebook
please take a note of that File uploaded path
2.5 Loading a csv file
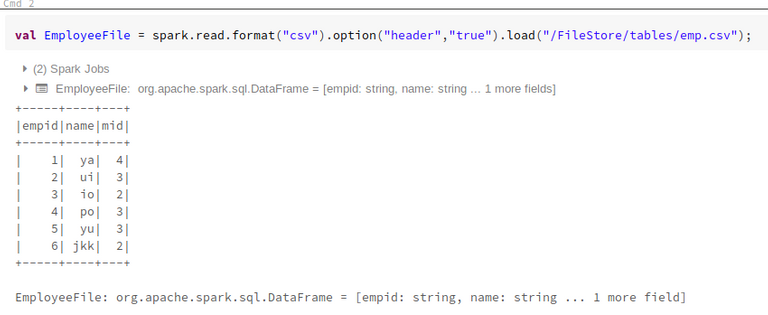
The code below will read a CSV file form the provided path which we got earlier.
val EmployeeFile = spark.read.format("csv").option("header","true").load("/FileStore/tables/emp.csv");
2.6 Exploring Spark-UI
As we have the DataFrame created with name EmployeeFile, we can run some spark transformation and actions on it to learn about how to inspect job, stages, tasks in spark-ui.
import org.apache.spark.sql._
import org.apache.spark.sql.functions._

EmployeeFile.groupBy("mid").agg(count("mid")).show
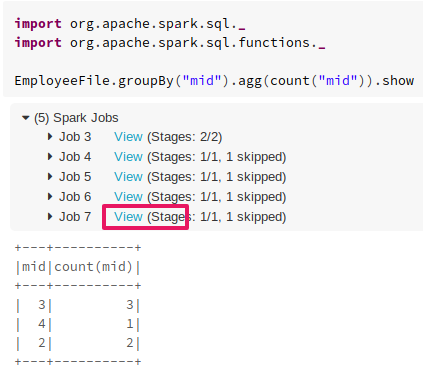
Fig: performing some groupBy and aggregations
open View (highlighted in red color) in a new window, then you will be redirected to Spark-UI page.Which is a very important component of spark because you can visualize your cluster and jobs, tasks and log files all at one place. The Spark-UI gives you a big picture of the background flow of computation.
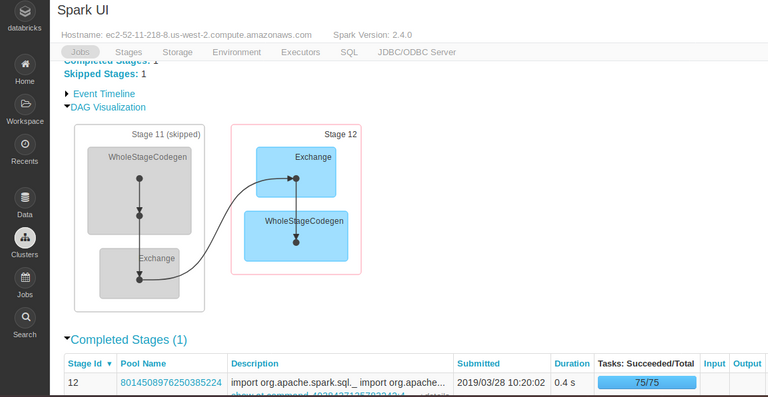
Fig: Showing different components of Spark-UI
Explore more about Spark-UI here
2.7 Display Html in notebook
One great thing about the notebooks is that you don't have to develop other separate web application and connect your spark application to it via an API call to display results. You can compute the result in spark and display the results in an HTML.
create a color variable which holds the value
val color = "red"
color variable will be used in html and can be rendered dynamically. In order to use vaiables inside displayHTML use this syntax ${Var_name}
displayHTML(s"""
<svg width="100" height="100">
   <circle cx="50" cy="50" r="40" stroke="green" stroke-width="4" fill=${color} />
   Sorry, your browser does not support inline SVG.
</svg>
<h1>heading</h1>
""")
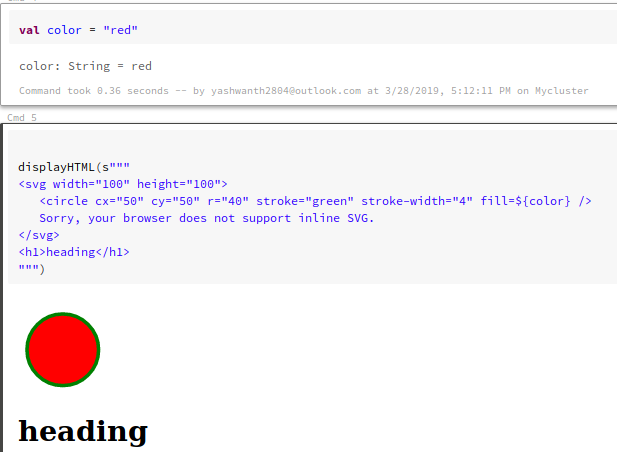
You can find this notebook published at this link
Curriculum
Proof of Work Done
https://github.com/yashwanth2804/Spark-IMDB-Graph/tree/master/DATABRICKS/SAMPLE

After reviewing your tutorial we suggest the following points listed below:Thank you for your contribution @yashwanthkambala.
Using the first person in the tutorials makes it difficult to understand the tutorials. We suggest using the third person in your text.
We suggest you use GIFs to show results because it is better than standard still images.
While this can come in handy, basic on screen instructions are normally not the best content we look for under utopian tutorials.
Your contribution has been evaluated according to Utopian policies and guidelines, as well as a predefined set of questions pertaining to the category.
To view those questions and the relevant answers related to your post, click here.
Need help? Chat with us on Discord.
[utopian-moderator]
Thank you for your review, @portugalcoin! Keep up the good work!
Congratulations @yashwanthkambala! You have completed the following achievement on the Steem blockchain and have been rewarded with new badge(s) :
You can view your badges on your Steem Board and compare to others on the Steem Ranking
If you no longer want to receive notifications, reply to this comment with the word
STOPDo not miss the last post from @steemitboard:
Vote for @Steemitboard as a witness to get one more award and increased upvotes!
Congratulations! Your post has been selected as a daily Steemit truffle! It is listed on rank 23 of all contributions awarded today. You can find the TOP DAILY TRUFFLE PICKS HERE.
I upvoted your contribution because to my mind your post is at least 9 SBD worth and should receive 137 votes. It's now up to the lovely Steemit community to make this come true.
I am
TrufflePig, an Artificial Intelligence Bot that helps minnows and content curators using Machine Learning. If you are curious how I select content, you can find an explanation here!Have a nice day and sincerely yours,

TrufflePigHey, @yashwanthkambala!
Thanks for contributing on Utopian.
We’re already looking forward to your next contribution!
Get higher incentives and support Utopian.io!
SteemPlus or Steeditor). Simply set @utopian.pay as a 5% (or higher) payout beneficiary on your contribution post (via
Want to chat? Join us on Discord https://discord.gg/h52nFrV.
Vote for Utopian Witness!
Congratulations @yashwanthkambala! You received a personal award!
You can view your badges on your Steem Board and compare to others on the Steem Ranking
Vote for @Steemitboard as a witness to get one more award and increased upvotes!
Congratulations @yashwanthkambala! You received a personal award!
You can view your badges on your Steem Board and compare to others on the Steem Ranking
Do not miss the last post from @steemitboard:
Vote for @Steemitboard as a witness to get one more award and increased upvotes!