Google Data Studio is a lovely reporting tool for PPC and SEO. There are some great ways to use Data Studio to create beautiful reports. What’s even better, Google just made it globally available and free for everyone. We believe Data Studio will be a game changer for digital marketing reporting.
In this post, I’ll explain why Facebook is a problem for Data Studio and how to overcome it. If you want to dive straight in and copy my template, jump to this part of the article.
Here is the final look of the Facebook Ads template created with Supermetrics for Google Sheets and Google Data Studio:

The data source (or Facebook) dilemma
Understandably Data Studio now only works with Google data sources, such as AdWords, Google Analytics, DoubleClick, YouTube, etc. On the other hand, most businesses don’t confine their online marketing to the big G.
Many digital marketers we talked to want to use Data Studio for PPC reporting. And there is a behemoth in the PPC world, which is Facebook. Almost every company, that advertises online spends on both Google and Facebook, if not also on Bing, Twitter, LinkedIn and other platforms. Some small local businesses even lean more towards Facebook because of its unparallel targeting capabilities.
That’s when Data Studio’s lack of native integrations with other advertising networks becomes a show stopper for PPC reporting. Of course, you can’t have your AdWords reports built with Data Studio and your Facebook Ads, Bing, Twitter and LinkedIn reports built with some other tools. The difference in styles, formats and technical limitations on what you can include in your reports won’t make you look good.
Our solution: the Google Sheets connector
You shouldn’t stop using Data Studio just because you can’t get non-Google data. Did you notice that you can use Google Sheets as a data source? That’s where you can have a almost perfect solution. In a guest post we published on the official Google Analytics blog, we talked about how to get Facebook, Bing, Twitter & more into Google Data Studio.
Don’t have the time or patience or interest to play around with Data Studio and Google Sheets? No worries. We understand the pain and decided to prepare ready-to-use templates to make it even easier.
All what you need to do is to copy the Google Sheet, copy the Data Studio template and connect this Data Studio report to that sheet.
You can most likely get it done under 3 minutes. Yes, only 3 minutes.

A free Facebook Ads template
Our 1st Data Studio template is for Facebook Ads. It uses the same styling and structure as the Sample AdWords Overview Report. provided by Google.
Follow the instructions below to duplicate it for your Facebook Ads accounts.
Make a copy of the Google Sheet with raw data.
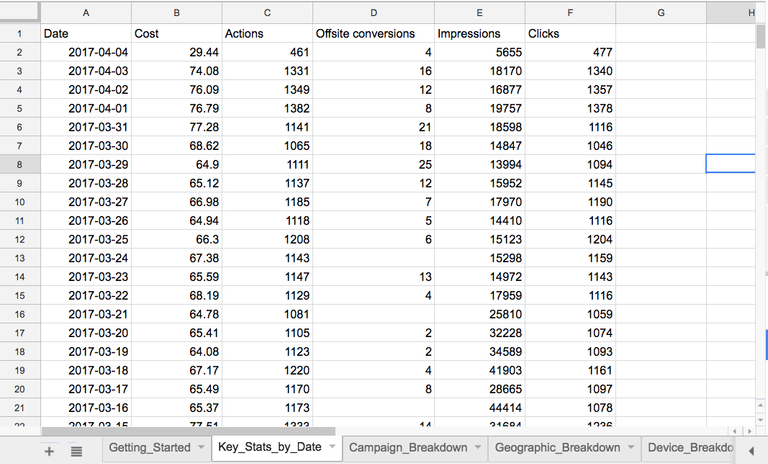
Here is how the sheet looks like. Note it has multiple tabs.
Step 1: Copy the URL of the sheet:
Step 2: Add it as a Custom Template in the Template Gallery of our Google Sheets add-on.
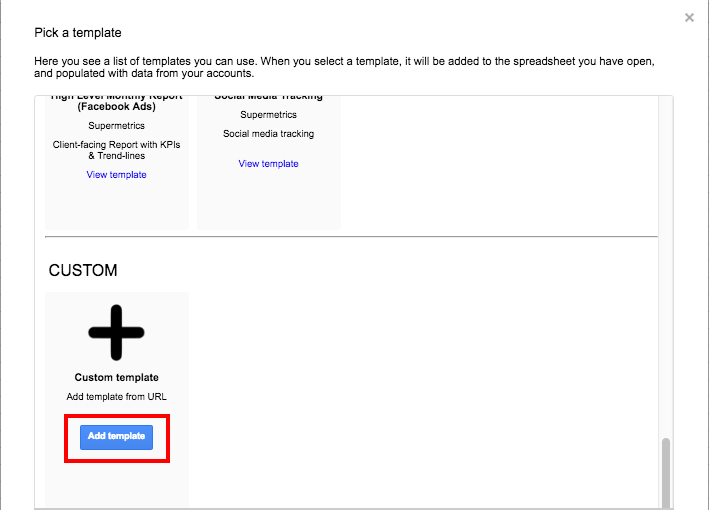
Don’t know how? Find it out in this previous post.
Step 3: Give a name to the sheet. In this example, I named it as My Facebook Ads Data.
Set up automatic refreshing for the Sheet
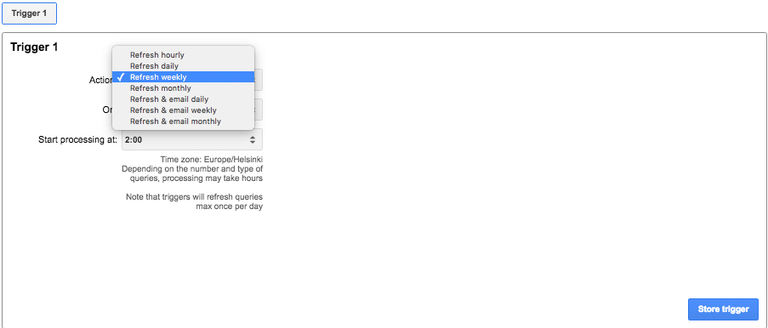
Click ‘Schedule refresh & emailing’ in the Supermetrics sidebar or the Add-ons menu, to launch the trigger window.
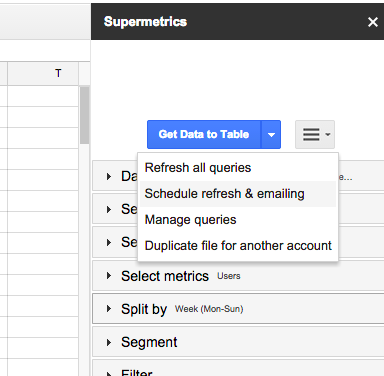
Select the trigger type: refresh hourly/daily/weekly/monthly, however often you want to refresh this report.
Copy the Data Studio report
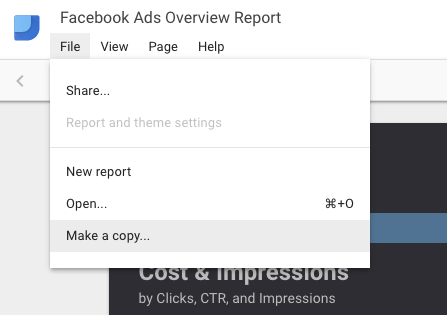
Step 1: Make a copy the Facebook Ads Overview Report
Step 2: Connect to the copied Sheet as a data source in Data Studio
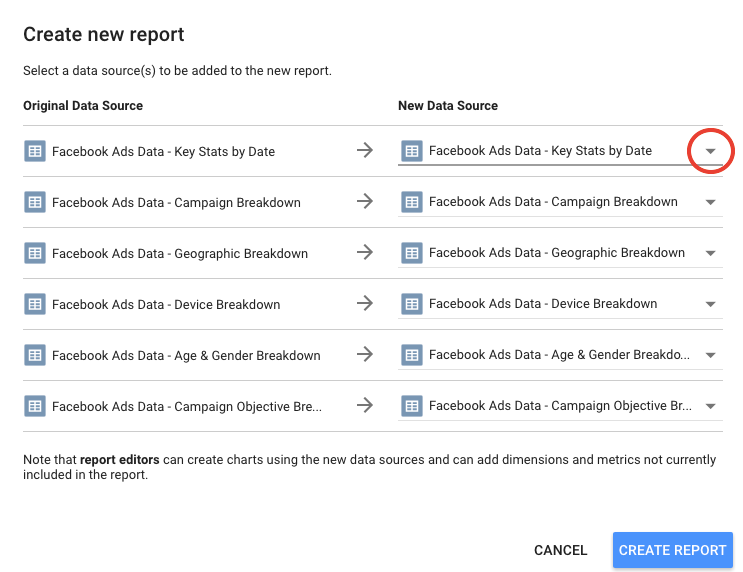
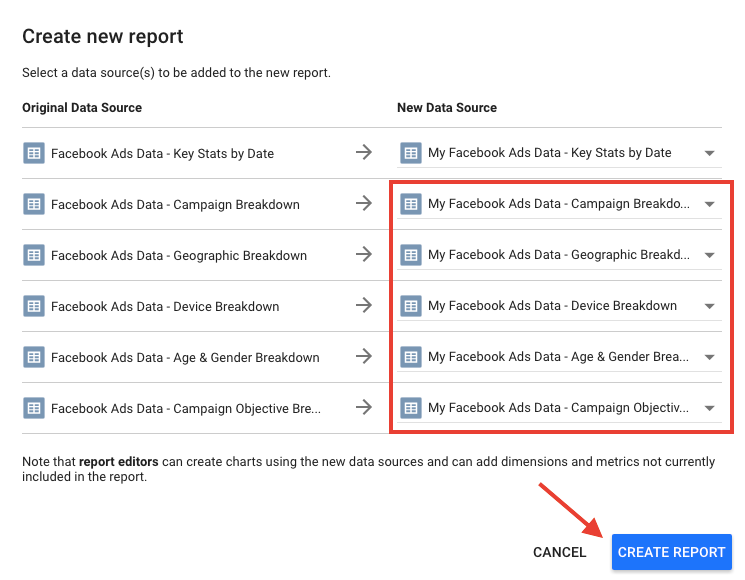
When the report is copied, it keeps the original data sources as the default ones for the new data sources. Click on the arrow on the right to change it.
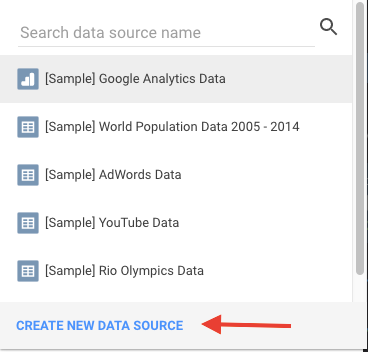
Step 3: Choose Create New Data Source
Step 4: Choose the copied spreadsheet and the worksheet Key Stats By Date, and click Connect.
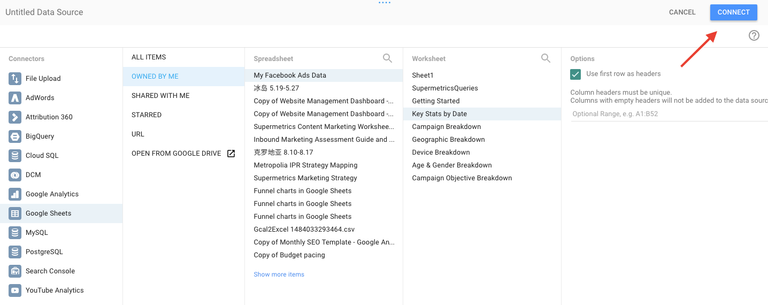
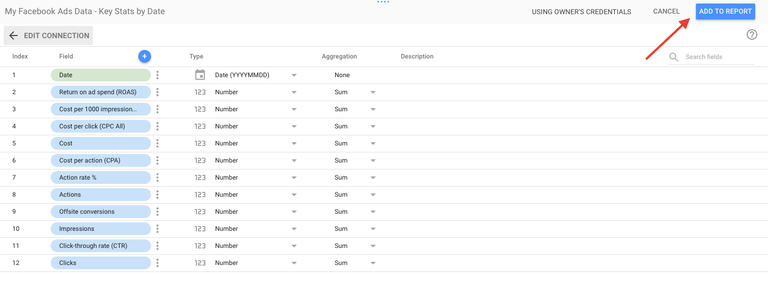
Initially the calculated fields aren’t copied. You’ll have to create them yourself. It’s rather straightforward.
Use the small blue plus button to create a new field, type in the name and the formula, and then click on the blue Create Field button on the right.

Step 5: Then click Add To Report in the next screen.
Step 6: Repeat it for the other five data sources, without creating calculated fields, and finally hit on Create Report.
Here you go, your Facebook Ads report is ready!

How to create your own Data Studio reports via Google Sheets
There are only three steps really. 1. Pull the data into Google Sheets -> 2. Connect to that sheet as data source -> 3. Create your report
For step 1, the key is to pull the data into a separate sheet for each dimension you want to report. In this template, I have six sheets for the six dimensions I want to report on, date, campaign name, countries/regions, device, age/gender and campaign objective.
It’s pretty straightforward to to connect to a sheet as a data source
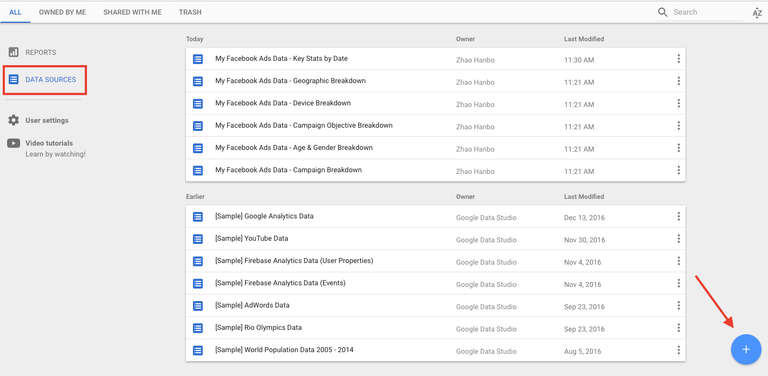
Just make sure you create a data source for each worksheet that you want to include in the report.
In the end, it’s all about creating beautiful reports in Data Studio. There is a bunch of tutorials and guides out there:
Official video tutorials from Google
This step-by-step guide by Daniel Waisberg
A beginner’s guide by Tyler Thursby
6 advanced tips by Ben Collins
Free ecommerce template from LunaMetrics
Google Analytics template from LunaMetrics
Two advanced tricks
Date format
Make sure the formats of your dates and times are compatible with the ones supported by Data Studio. Otherwise they won’t be recognized as date/time.
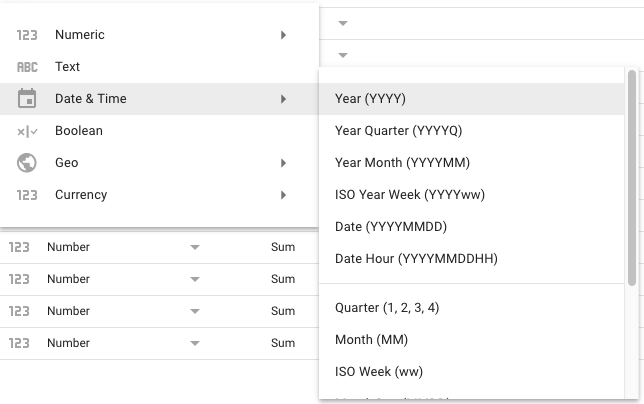
If you split data by dates, it would work perfectly OK.
You may run into issues if you split data by month or year. For example if When your data is split by year & month, it looks like 2017|01 in Sheets. And when this sheet is connected to Data Studio, these month numbers aren’t recognized as months.
The root cause is in Google Sheets there is no such a cell format as month or year. The values are always dates and just shown as month or year.
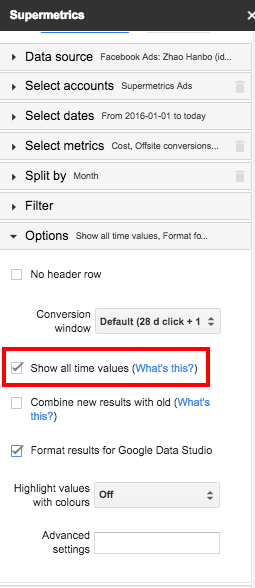
After hearing the same problem from many, we decided to develop a solution and added this Format results for Google Data Studio under Options. Make sure this box is ticked when you’re splitting data by week, month or year.
Watch out Aggregation
Data Studio uses Sum as the default choice for Aggregation.

Sum makes sense for some cases but not all. For instance, you would never sum up ROAS or conversion rates. Choose the Aggregation wisely for your metrics.
There are only six aggregation types Data Studio offers, Average, Count, Count Distinct, Max, Min and Sum. If none of them fits your needs, you’ll have to use calculated metrics or pre-calculate your metrics in Google Sheets before importing them into Data Studio.

It’s a beginning, not an end
Congrats now you’ve built you first FB Ads report in Data Studio. But you shouldn’t and probably won’t stop here if you also advertise on other networks like Bing, Twitter and Linkedin. You can follow the same way to fetch those via Google Sheets.
Or if you prefer using ready-made templates like this Facebook Ads one, signed up for Supermetrics for free and we’ll deliver more awesome templates to your inbox.
It will be very very very useful to all entrepreneurs!! It's absolutely free and an essential thing.
We can analyze what we do through social media regarding our business and target the right customers without much effort!!!
Source: https://supermetrics.com/blog/facebook-ads-data-studio/
Not indicating that the content you copy/paste (including images) is not your original work could be seen as plagiarism.
Some tips to share content and add value:
Repeated plagiarized posts are considered spam. Spam is discouraged by the community and may result in action from the cheetah bot.
Thank You! ⚜
If you are the author, please reply and let us know!