It's good to see your solo EW analysis. The first ABC should be the W; where you have your W should be an X; where your X is should be Y; your Y should be X and you last X should be Z. So, it would men the WXYXZ is complete. Your call for lower low is a valid scenario.
You are viewing a single comment's thread from:
Dear @haejin thank you for your feedback, but I would have to disagree and would like to further discuss this with you. I have labeled my chart again as to simplify my takeaway. Take a look:
As you suggested the first structure is a W wave, and that is true in my mind but not as incorporated with the waves from the second structure that is consolidative in nature. The first structure should be viewed as one whole and not be mixed with the second one. The second structure can be either a WXYXZ (my primary count) or another intermediate WXY in which another minor WXY is incorporated (alternative count).
Current wave high will determine the validity of my count - if the price decreases from here then my WXYXZ count is in play, and if it increased (up to 12000$ max which is the high from the second intermediate W wave) then the alternative count is in play.
In both scenarios, I am expecting the price of Bitcoin to go significantly lower as Structure 3 will occur as a trend continuation after some period of consolidation.
Stellar Lumen is showing a similar pattern to Bitcoin and so are other cryptos as the market is strongly correlated, which is why I think your XLM count is unlikely.
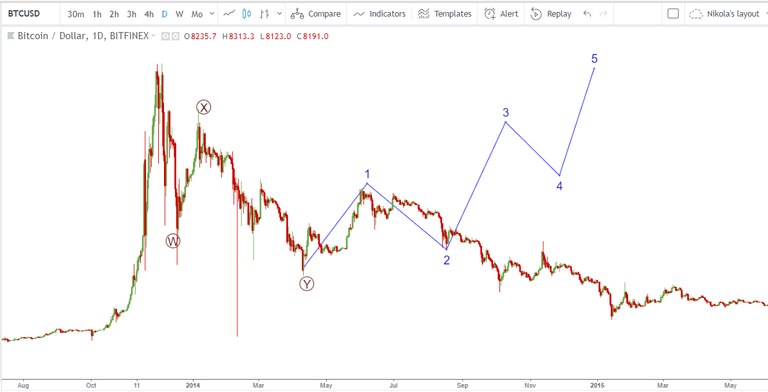
Similar correction happened in 2014 and I have labeled the equivalent prices to the current once.
The price of Bitcoin retraced back to the levels from which the all-time high was made as the wave Y ended which would today be 3000$ or less to 2700$.
You view is rather a simplistic one: motive - correction-motive. Applied on the Bitcoin chart from the 2014 correction it would look something like this: