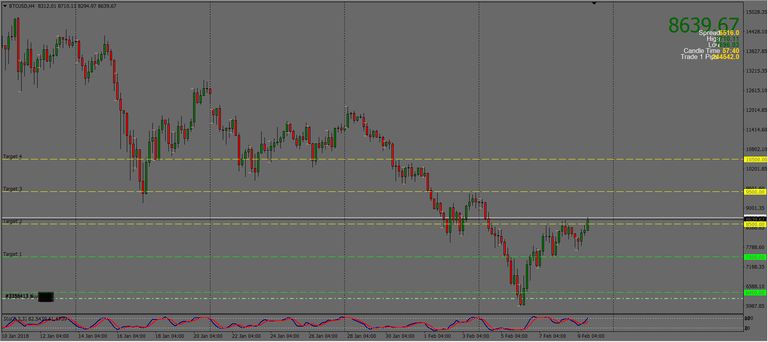
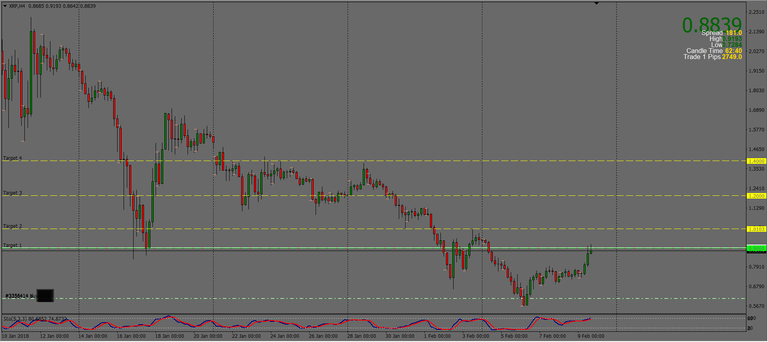
Below we have two charts of calls that were sent early this week to our clients of levels and entries that could potentially reverse the market.
First we have #BTC which i was finally at least short term bullish once my $6,400 level was hit.
As you can see a position was taken at $6,194 and now I am holding in hopes to see the market show enough strength to consider it long term bullish.
Targets are as follow:
Target 1: $7,500 ✅✅
Target 2: $8,500 ✅✅
Target 3: $9,500
Target 4: $10,500

As for #XRP -- one of my personal favorites -- We ended up making the 1 more push down that i had said could potentially happen.
I liked the move as it triggered some bullish signals short term and decided to get in. Buy was taken at $.6090
Targets are as follow:
Target 1: $.90 ✅✅
Target 2: $1.05
Target 3: $1.20
Target 4: $1.40

I have very high hopes for XRP so it would be great to see some long term bullish signals.
Look forward to one of the biggest bull markets we have ever seen.
Upvoted ☝ Have a great day!
Thank you! I appreciate it.
So your trading is based on horizontal lines? May I suggest you to take a look at Fibonacci number/retracements?
Thank you for the suggestion.
This is the analysis, I do not show people here how i arrive to my conclusion. I will admit though my tools do use fibs 😊