Hey guys,
It seems like it gets to Sunday night here and not only do I still want to be away from charts and enjoying myself, but it seems like the markets are always at peak shitness.
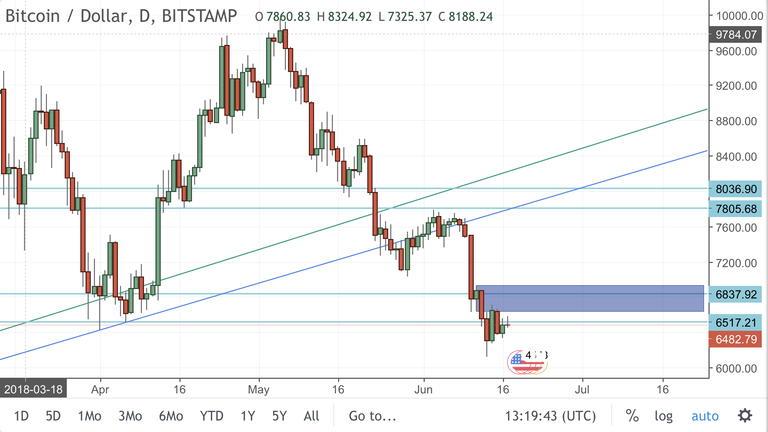
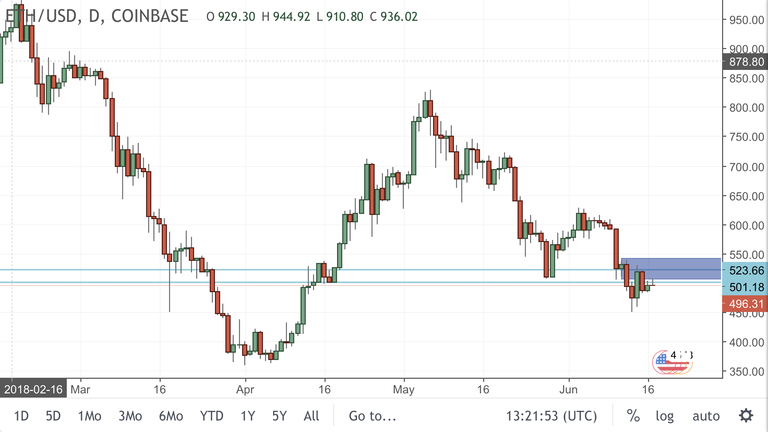
Oh look at that. So not only is today a Sunday, I don’t want to be here AND the markets are going to shit. Just take a look at the following two daily charts, will you:
BTC/USD Daily

ETH/USD Daily

That is bear market continuation setup personified. Absolutely crushing to see the big two just about to roll over to start yet another week.
Just to add some context around the charts if you aren’t a long time follower of my charting style, we have higher time frame support zones that have now flipped to act as resistance. I’ve added the extra box that is looking like holding as a confirmation that previous support has in fact flipped to resistance.
Enjoy the rest of your weekend...
✌🏻.
@forexbrokr | Steemit Blog
Market Analyst and Forex Broker.

Twitter: @forexbrokr
Instagram: @forexbrokr
We just have to wait, ETH and BTC will blast off soon enough! Thanks for sharing
upvote
I dont just believe in shills anymore, I sold all my alts and BTC while Bitcoin was still $7.5k.. Now I hedge to USDT. I expect BTC to be $5k to $3k in the next few months.