Bitcoin has been in a massive downtrend pretty much all of 2018.
There have been some relief rallies along the way, but for the most part, prices have continued to make new lows every couple of months.
That is in stark contrast to what many believed first entering the year.
People had been calling for all kinds of "high prices". From $25k all the way up to $100k, and there was no shortage of predictions landing anywhere in between.
Those predictions look pretty silly now as we are more than half way through the year and the price is a long ways away from even the more conservative of those predictions.
However, we may be on the verge of a trend change and a rather large move up.
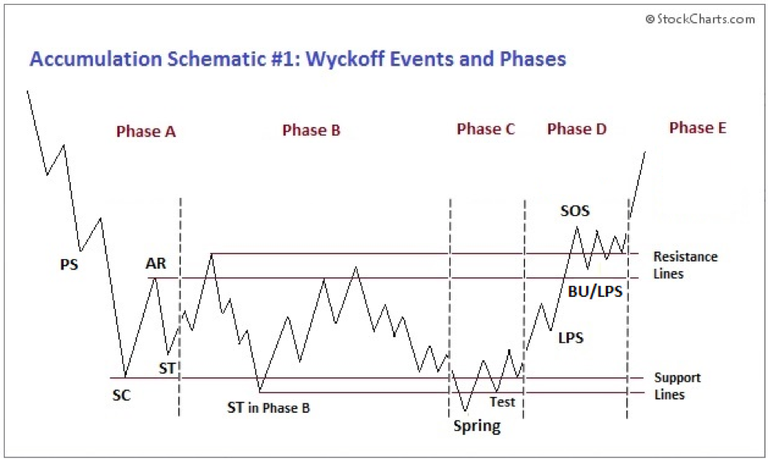
Check out this chart:

(Source: http://stockcharts.com/school/doku.php?id=chart_school:market_analysis:the_wyckoff_method)
That is a chart of the accumulation phase according to the Richard Wyckoff theory of markets and price action.
According to Richard Wyckoff, there are 4 major phases of market activity and price action:
- Accumulation
- Mark Up
- Distribution
- Mark Down
As you can see, the chart above shows what often happens during the accumulation stage before an asset or security makes a move higher.
Does that price action look at all familiar to anyone else?
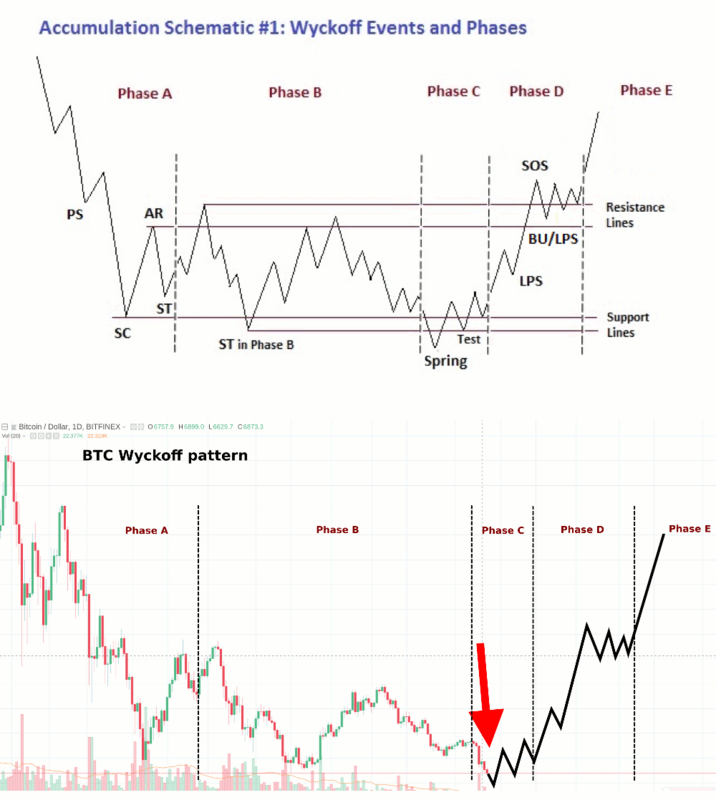
Enter Bitcoin:
Let's take a chart of bitcoin and compare how it has been trading over the last 6 months to that of the accumulation chart above...

Look at that, it matches up almost identically.
What's more, that red arrow points out to where we are currently on that chart.
If that trend holds up, bitcoin is on the verge of finally breaking out of this accumulation stage and heading much higher.
There is no guarantee that history will repeat or that this chart pattern will hold up, but it is very interesting that bitcoin mirrors almost exactly the kind of pattern that Mr. Wyckoff noted oh so many years ago had a tendency to precede large moves higher.
Here's to hoping history repeats!
Stay informed my friends.
Follow me: @jrcornel
I just love short term predictions - they are easy to be proven right or wrong. Sooo... will see.
I'm personally do not like TA, but I'm bullish )
Everytime BTC has made a really large jump to a new level, there's been a sell off prior and after, before settling into it's new zone. I feel like this last month will be one of the last time's to get into bitcoin under 7k. From late summer on, we'll see 10-15k and up. Mining is getting harder. BTC usage is still growing. Supply and demand.
I remember Charlie Shrem saying May was the last time we would ever get bitcoin under $10k... hopefully he was just off by a month or two. :)
I think estimating the 'time' of the bottom is nearly impossible. All I can say is that bitcoin will certainly be worth more than it is now at some point in the future.
I wonder how much of a factor in the price dropping is that it seems there are new variations on crypto currencies showing up on the scene regularly, so the money is more spread across multiple platforms, meaning less demand on any individual one.
Also the fear factor of how many stories keep popping up of markets being hacked or whatever, could cause some hesitation for people jumping in?
Both very good points, although we understand that these hacks are rarely ever relevant many newbies wouldn't and it would definitely act as a deterrent. As far as money being spread among crpytos and ICO's I think that's why its also very important to be looking at the overall marketcap.
Even if this scenario plays out, there's a still the question of how low the "spring" will dip before moving on to phase D.
January 13, 2015 (around the first time that I heard about bitcoin) was the low, or "selling climax" (SC), of the correction from the Mt. Gox bubble. The range on that daily candle from opening to the low was over 32%!
You can see from the images that I provided (the upper is a daily chart and the lower is a weekly) that the price action wasn't exactly textbook Wyckoff. For instance, the spring never reached lower than the selling climax, but it followed the blueprint for the most part.
(right click + view image for enlarged image)
I share this only to demonstrate how this type of scenerio has already played out in bitcoin before and, wouldn't you know it, it was right after a price bubble correction!
But the point I want to make is that the spring is often a second "selling climax" event. So, you might have instances of huge percent selloffs in a single day or series of just a few days before price picks back up to move on to late phase C and early phase D.
I don't claim to be an expert at Wyckoff TA, but I do use it a bit and I've seen enough real life examples of markets that meet the guidelines to qualify as a Wyckoff "accumulation event" to know that fitting the guidelines, even as far up as late Phase B aren't very helpful when it comes to trying to estimate the bottom in terms of price (time, yes, pretty close, but price is a different story).
It's pretty much impossible to predict what type of a selling climax might (or might not) come with that last dip below the support zone. Of course, it's also not possible to know whether it will play out like Wyckoff's example at all after phase B. That's TA for you :)
Of course, though finding the exact low was never the point of this. The point was that there may be some light at the end of the tunnel, even if there still might be some short term pain ahead first. :)
Oh, I know. I'm just speaking to the people who might be trying to catch the bottom. I was one of those guys in the 2015 chart that I showed and I actually did a decent job (catching the bottom)...luckily.
Looks hopeful but you can never tell with these markets...
All it has to do is follow the charts. Seems easy enough. :)
Hope it moons!
Hope Wyckoff knows where of he speaks 😬👍😬
It's pretty amazing that the patterns he noticed roughly 100 years ago still tend to repeat in today's markets.
I was just telling my friend on the phone about 30 minutes ago that we are going to drop a little further before we reach a point that buyers will be interested again. The fact that we are below the cost of production for many miners will eventually create a market scarcity and this will propel the price back up.
Perhaps. Though the cost of mining seems to vary wildly depending on where you are.
Very true I know in Australia it can be 10K per bitcoin (where I'm from) and in other nations as low as 3K.
I did not understand much of it. The technical terms went over my head. Is there any source any one can suggest me through which I can learn to read these graphs.
I'd like to believe it but I wouldn't be surprised if we still had a couple thousand more to go down before we started heading up again..
absolutely, and it could also be for an extended period of time we stay in this accumulation phase
yes, bitcoin consolidation is over and we will have a rally next week for the entire crypto markets
That would line up very well with what this chart pattern is indicating.
Yeah for sure it's deeps shows its urge for moving ahead.
I would welcome this. Should also affect steem prices positively
Yep, hope it can move to an Uptrend. Yep maybe a Double Bottom formation ??
It's the first time i've heard of the Wyckoff TA. I was thinking accumulation was happening very recently and made a ladder buy.
Also don't hate me for posting my link but I feel like it's necessary for a lot of people to see this chart again. https://steemit.com/bitcoin/@pwny/never-forget
Apparently his teachings are followed by a lot of traders today. Pretty impressive considering they were developed over 100 years ago. Financial markets have changed quite a bit since then, but apparently the behavior of people in those markets hasn't. :)
That's actually what I found interesting about Elliot wave theory. It was developed 100 years ago as well.
I am still hopeless about Bitcoin. I assume estimating the 'time' of the bottom is almost impossible. all i can say is that bitcoin will certainly be worth greater than it's miles now in some unspecified time in the future inside the future.
Wow after seeing the chart and analysis this could be a major move in the uptrend will have to wait a little bit but seems like something major is coming up can't wait to see that :)
I am patiently waiting for that uptrend. I may have a few free funds to invest in a position.
FREE STEEM JUST PUT ON VIDEO IN SMALL WINDOW AND LET RUN IN BACKROUND https://www.earncrypto.com/earn-free-steem/?r=173685
Lot of people think we are going to touch $5k... which probably means it won't happen. :)
I agree with you...BTC could still drop to the mid $5000's, which would be healthy. Some great buying opportunity at those prices. Then things should turn around for BTC. Once things start moving up for crypto, people will hop back on board. I think lots of smart money is waiting on the sidelines at the moment waiting for the bottom.