
Hello everyone! Pozdrav svima!
Today I'm going to show you how you can easily track your Splinterlands earnings using the Currency Activity feature inside the game. More precisely the Export Custom History feature that allows you to download all the transaction to and from your Splinterlands account for a given time period in an organized CSV format.
Whether you want to track you market purchases/sales or your rentals, battle DEC rewards or focus chest rewards - it's all in there.

~~ CURRENCY ACTIVITY ~~
First thing we need to do is go to Currency Activity section of the game. We can do that by clicking on our profile name in top right corner of the game window and then clicking on Currency Activity.
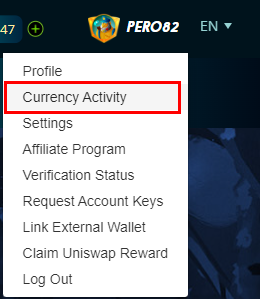
This will open the Currency Activity window as shown in picture below.
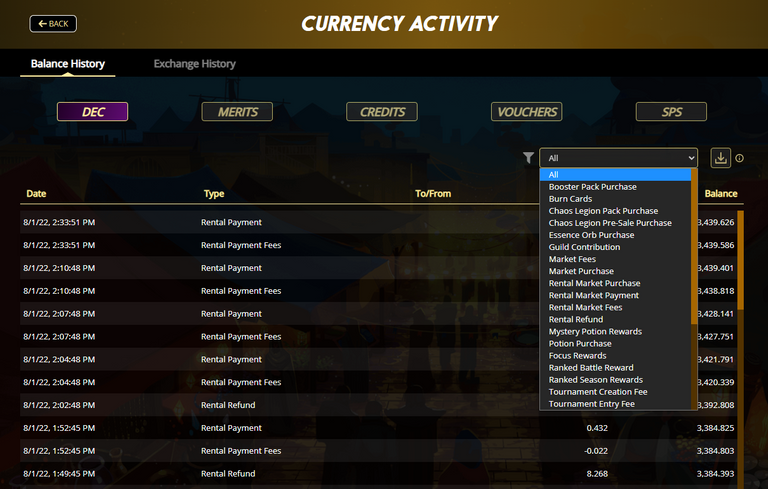
As you can see, all your transactions are shown in a neatly organized table and you can filter them by type of transaction (Market purchase, Rewards, etc.) and currency (DEC, Merits, Credits, Vouchers or SPS). Problem here is that you can't easily copy this table and paste it to Excel or some other program where you want to do some calculations. That's why the devs implemented Export feature (icon highlighted in the picture below).
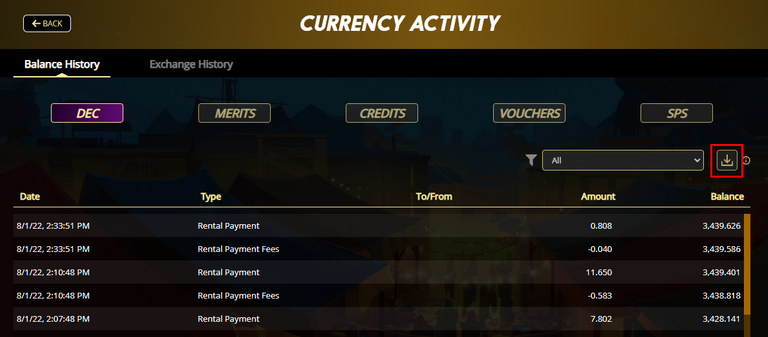

~~ EXPORT CUSTOM HISTORY ~~
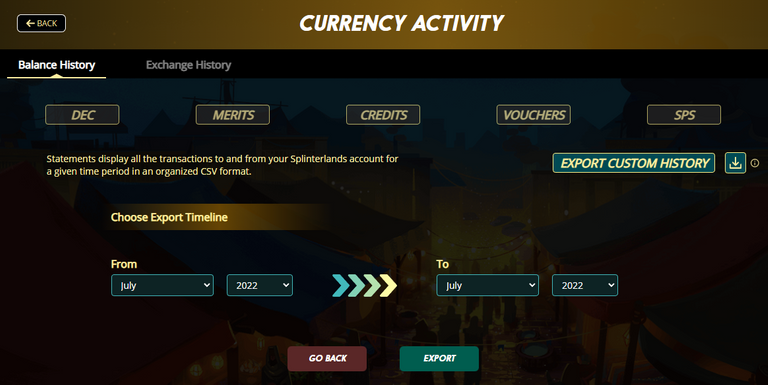
Now you can download transaction for the whole year if you want, but then you will get a bunch of data you might not need. What I do is click on Export Custom History (as shown in picture below) where you can select start month/year and end month/year for your transaction history. If you select the same start month/year as the end you will export that one month of transactions.
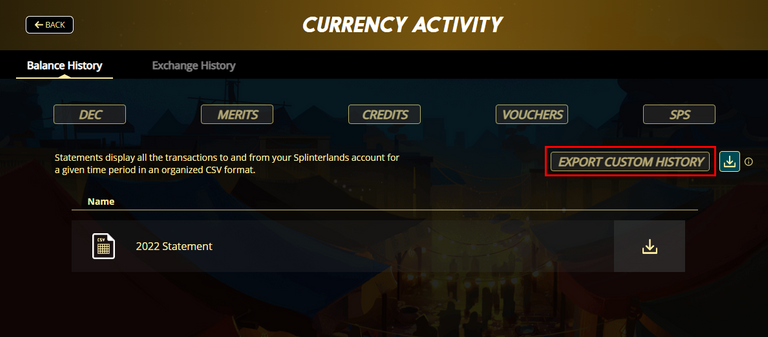
In this example I will export my transaction history for July 2022 and show you how I kept track of my rentals during this month.
As you can see in the picture below I selected From July/2022 -> To July/2022 and I downloaded "splinterlands-balances.csv" file to my computer (button Export) which contains all my transactions in the month of July 2022.
CSV files, or so called "comma-separated values", are plain text files that contain list of data, where each data entry is separated from the next one by a comma sign (,). CSV files are designed to be a way to easily export data and import it into other programs. The resulting data is human-readable and can be easily viewed with a text editor like Notepad or a spreadsheet program like Microsoft Excel.
Since we want to do some calculation with our data we will import it into Microsoft Excel.

~~ IMPORT DATA TO EXCEL ~~
Open the file with Microsoft Excel, and this is what you're going to see.
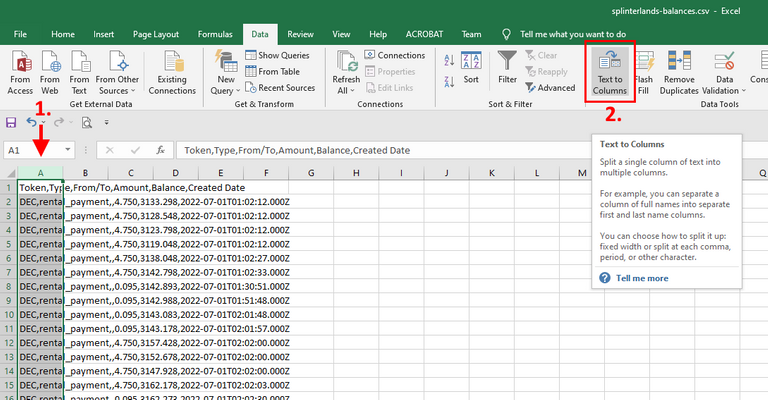
Select the first column list in the picture and in the Data menu click Text to Columns (like shown in picture above).
This will open a new window - 'Convert Text to Columns Wizard'.
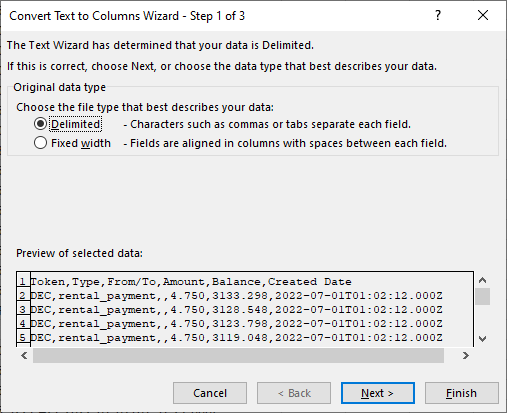
- Step 1 - Just click Next (just make sure 'Delimited' option is selected).
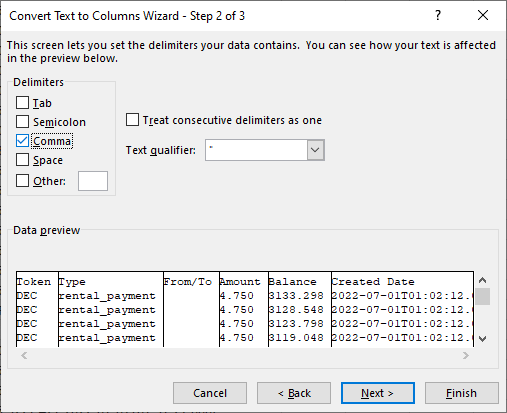
- Step 2 - Select 'Comma' under Delimiters and deselect all others (if selected), and click Next.
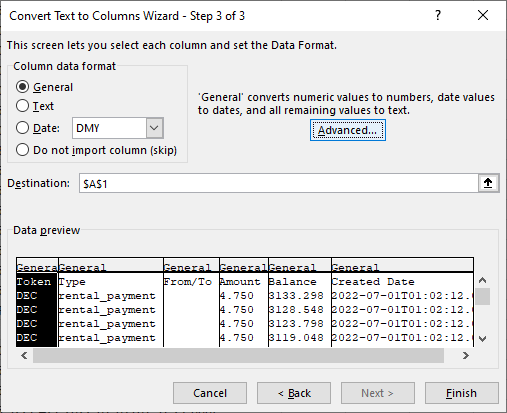
- Step 3 - If you have regional settings that use comma sign (,) for decimal separator and dot sign (.) for thousands separator (like we do, in Croatia and other parts of Europe) then click Advanced... button and it will open 'Advanced Text Import Settings' window (picture below). If your regional settings are the other way around then you can just click Finish.
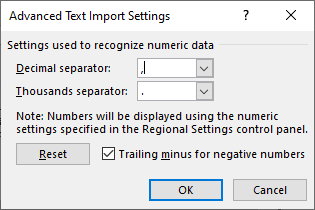
- 'Advanced Text Import Settings' allow you to change how you want to convert the numbers. So if you get some odd numbers after conversion you probably have to change Decimal and Thousands separator - in my case they are flipped around in respect to default. After you enter the separators, click OK and then Finish in previous window.

~~ FORMAT THE DATE ~~
After initial conversion from Text to Columns your table should look like the one in picture below. But the date is in some funny format (which is actually date and time expressed according to ISO 8601) so we have to convert it to "normal" date format so we could filter our data by date.
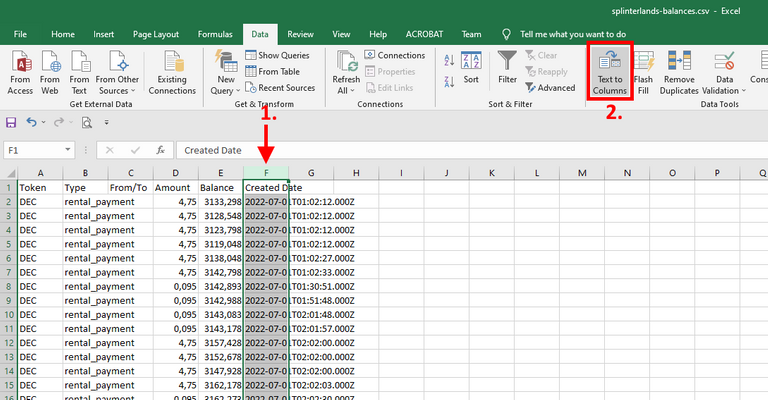
- First click on the column header of the 'Created Date' column to select the whole column and then click on 'Text to Columns' button in Data menu (just like we did a minute ago), this will open the 'Convert Text to Columns Wizard' again
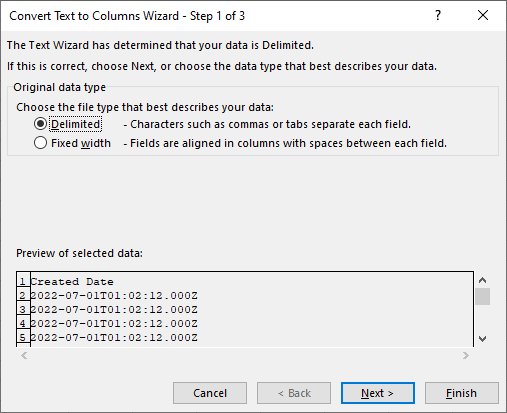
- Step 1 - Just click Next (just make sure 'Delimited' option is selected).
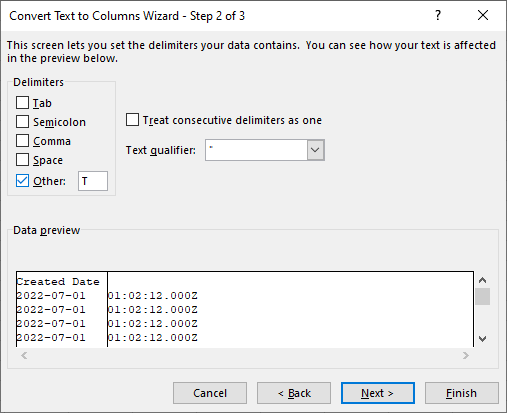
- Step 2 - under 'Delimiters' deselect all options except the last one marked as 'Other' and enter letter 'T' in the box next to it. Click Finish.

~~ APPLYING THE FILTERS ~~
Now that we are done with importing the data to our Excel worksheet, the table should look like the one in picture below. I deleted column 'From/To' and that extra column that was created when we did Date conversion.
- First column named 'Token' represents currency of the transaction (DEC, SPS, Credits etc.).
- Second column named 'Type' represents type of transaction (market purchase, rental payment, etc.).
- Third column named 'Amount' represents values of each transaction.
- Fourth column named 'Balance' represents your total balance after transaction.
- Fifth column named 'Created date' represents date (and time - but we're not interested in that so we removed that part) of the transaction.
In order to do our calculations we need to set up the filters.
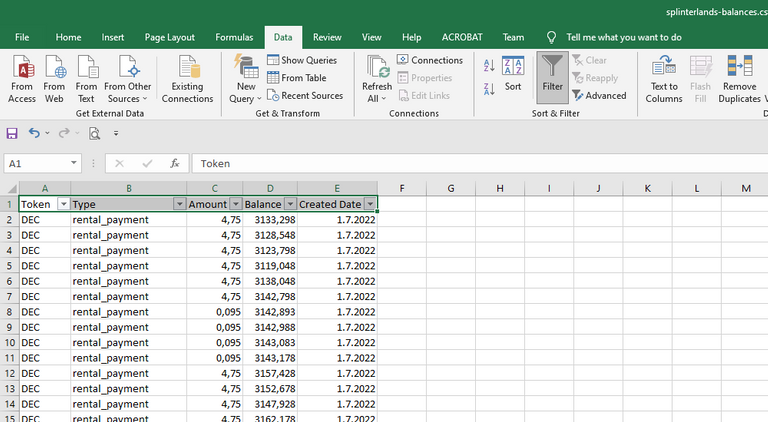
Select all cells in first row and click Filter button in Data menu. This will enable filters for each column (as shown in picture above).
In this example I will show you how to filter your transactions for rental market (DEC payed to rent cards from others and DEC received for renting cards to others).

~~ FILTER NEGATIVE VALUES ~~
First, we're going to filter out negative values for rental payment. These are transactions for cards we rented from other people. Also, we can include values for rental fees (fee we pay to market for renting cards to others).
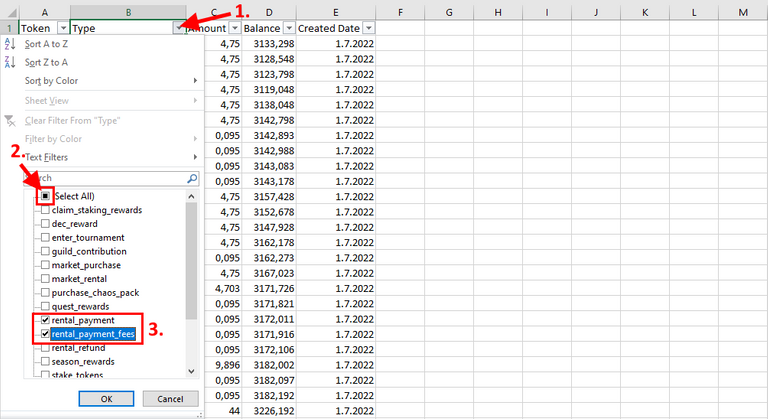
- Step 1 - Click on 'Type' filter.
- Step 2 - Deselect all filters by deselecting 'Select all'.
- Step 3 - Select only 'rental_payment' and 'rental_payment_fees'.
Now we're going to filter the date we want to make calculations for.
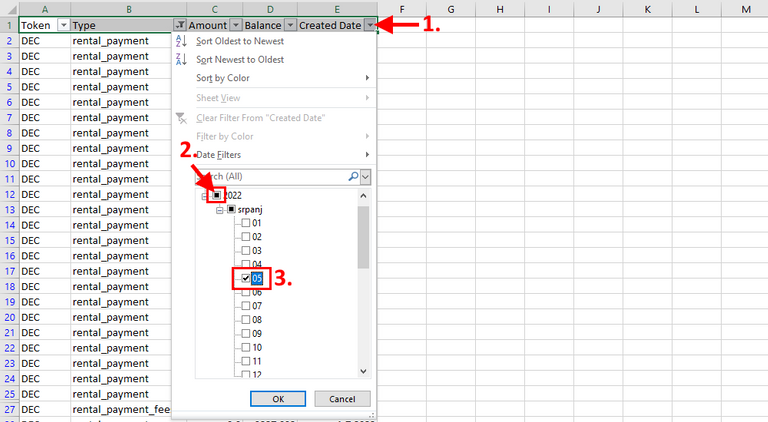
- Step 1 - Click on 'Created Date' filter.
- Step 2 - Deselect all filters by deselecting 'Select all'.
- Step 3 - Select the wanted date (in my example I selected July 5th - it's in Croatian on my screen, don't let it fool you).
After that we need to filter out only negative values in the 'Amount' column.
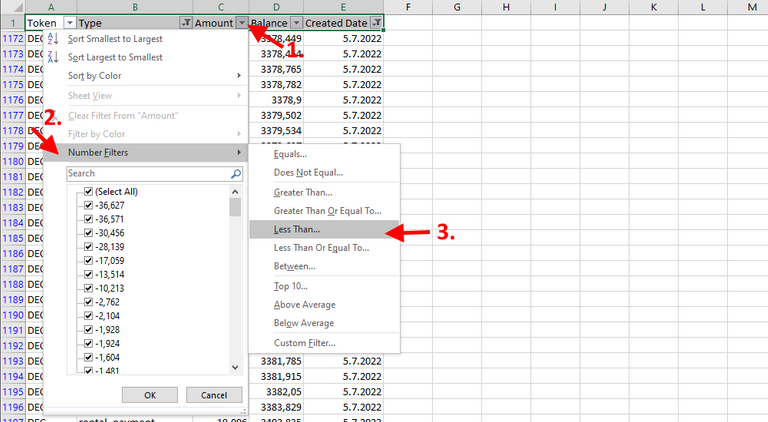
- Step 1 - Click on 'Amount' filter.
- Step 2 - Click on 'Number filters' in popup menu
- Step 3 - Click on 'Less Than...' in submenu
This will open a new window 'Custom Autofiller'.
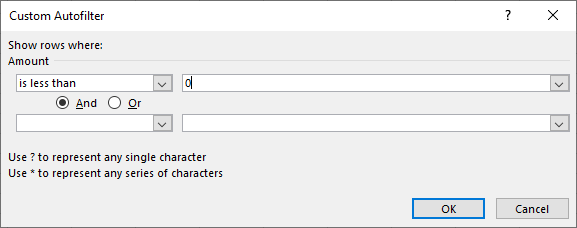
Make sure that option 'is less than' is selected and enter '0' in the box next to it. Because we want to filter out all transactions that have values less then 0.
Now our table is showing only negative values of type 'rental_payment' and 'rental_payment_fees'. With a simple SUBTOTAL function we can automatically add up all those visible values and copy the result in our table for tracking earnings.

In a cell next to the table enter this exact text '=SUBTOTAL(9; $C:$C)'. It will make a sum of all the visible values in column C ('Amount').

~~ FILTER POSITIVE VALUES ~~
Next, we're going to filter out positive values for rental payment. These are transactions for cards we rented to other people.
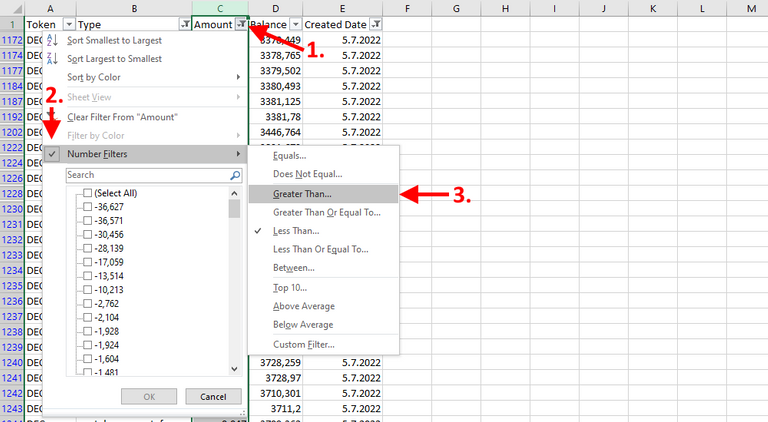
- Step 1 - Click on 'Amount' filter.
- Step 2 - Click on 'Number filters' in popup menu
- Step 3 - Click on 'Greater Than...' in submenu
This will open a new window 'Custom Autofiller'.
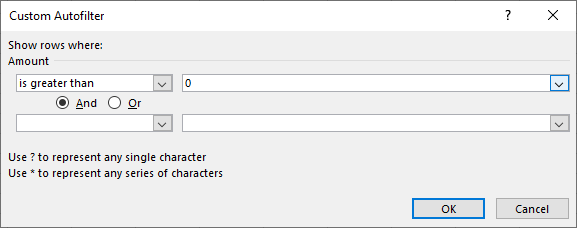
Make sure that option 'is greater than' is selected and enter '0' in the box next to it. Because we want to filter out all transactions that have values greater then 0.
Now our table is showing only positive values of type 'rental_payment' (fees are always negative, so they don't show up here). With a simple SUBTOTAL function we can automatically add up all those visible values and copy the result in our table for tracking earnings.

NOTE: By filtering out only positive values, filter 'rental_payment_fees' sometimes gets deselected, so make sure it selected when you go back to negative values.
Repeat the procedure for any other day, or any other type of transaction.

~~ FINAL EARNINGS TABLE ~~
This is how my earnings table looks like in the end. I keep track of DEC earned from battles, DEC I get from focus chests and rentals. It's interesting to see how rental prices go up and down how season progresses.


~~ THAT'S ALL FOLKS ~~
That's it for now. I know this looks like a lot of work, but once you get the hang of it, its just a few mouse clicks and you're done.
I will try to upgrade this procedure with VB script in Excel so we don't have to manually filter values and do the calculating. I haven't done that for quite a few years, I'm a bit rusty, so it's gonna take some time. Make sure to keep an eye out. 👀
If you missed it, check out my Introduction post to Hive community (I know its long overdue, sorry). I just posted it few days ago, and you will see why it takes me so long to make a good post. 😜

If you still haven't tried Splinterlands try it out 👉 HERE 👈
Thank you for your time, and please vote if you like this post. 👍

Congratulations @pero82! You have completed the following achievement on the Hive blockchain and have been rewarded with new badge(s):
Your next target is to reach 2500 upvotes.
You can view your badges on your board and compare yourself to others in the Ranking
If you no longer want to receive notifications, reply to this comment with the word
STOPCheck out the last post from @hivebuzz:
Support the HiveBuzz project. Vote for our proposal!
Nice work
Hi
Thanks alot for the information. Have you had time to create the excel script yet? I would love to be able to use it if possible.
Best regards
Nemath
I did try to make the script, but it didn't work out as I imagined it would. Its not very pretty and its a bit buggy. I will try to find it and send it to you asap
Thanks alot mate