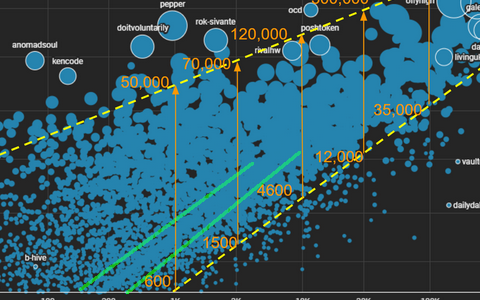
Not there, but let me highlight what I thought would be KE=2 in the other plots:
Here, there seems to be an increased density in the center between the two green lines no?
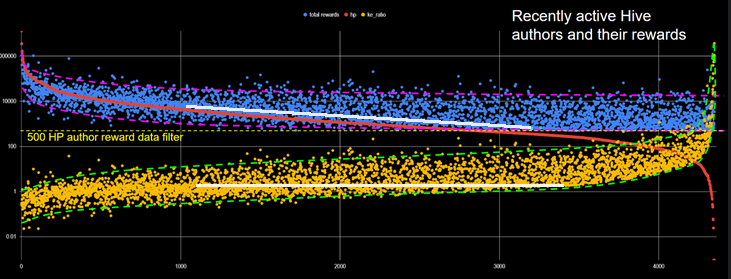
and here on the two white lines:
original so you can see below where I highlighted.
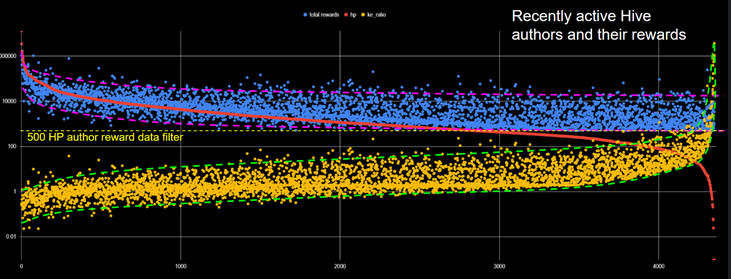
Maybe its nothing, I just thought it could be an interesting feature.
It’s nothing. Because both your highlights and my new are the same data. Just zooming in