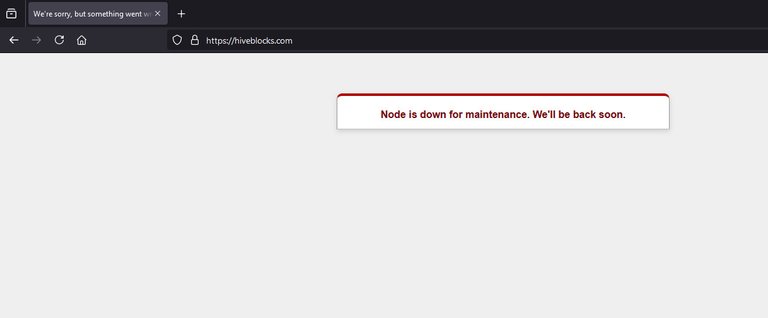
Threespeak) of 7,452 subscribers unable to post videos.It's no secret that one of the biggest disadvantages of using Hive is the frequency with which services go offline. @threespeak is the only video publishing service available in the entire ecosystem and it went down more than 24 hours ago, leaving at least its own video community (
The experience is not unique to @threespeak. I have seen failures at least once in each of the services I have used, but I found this case very interesting because no other service affects an entire community, since all the other tools have at least one alternative to publish and search for info.
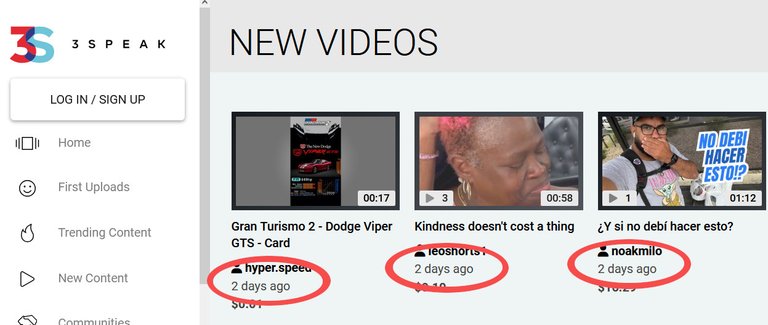
This made me think that we also don't have detailed metrics on the usage of our communities. Threespeak was completely down for a significant period of time, but we don't know how deep this affected the most active users or the level of impact this had on Hive, as inleo shorts were also affected.
I am a newbie and I can only dream of building a website that allows us to explore more specific data about all this activity. However, for now I can add a tiny contribution: Top10 users by community.
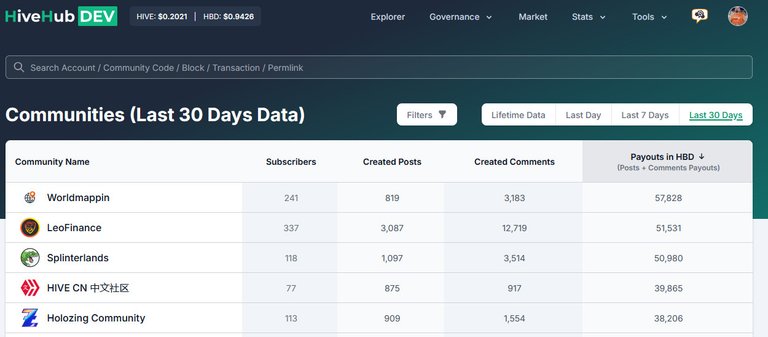
This is relevant information if we want to know a bit better about how our communities are formed and how they are distributing their income. I took information from HiveHub to choose the Top5 communities by revenue volume during the last 30 days.

An interesting fact is the data I downloaded in a CSV file, gets broken when I open it with Excel. I have to first open the CSV with LibreOffice Calc, to change the decimal point to comma and save it as an XLSX file so I can use it in Excel. I could keep using Calc, but I prefer Excel because it has some more convenient functionality than Calc and I'm just more used to it. I'm sure I can work around that with some sort of configuration in Excel, but I haven't taken the time to figure it out.
 *Original CSV on Excel*
___
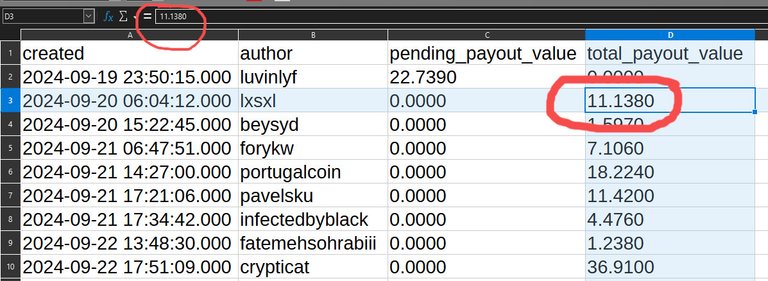 *Original CSV on Calc*
I'm sure there is a more efficient way to query all this data with a single more elaborate SQL query, but this is the what I've managed to do so far. (one community at a time)
The other information I decided to extract, was the top10 users with the highest revenue in the last month for each of these 5 communities.
For this I queried the list of posts of the last 30 days of each of these communities. Specifically I downloaded: creation date, user, pending payment and total payment.
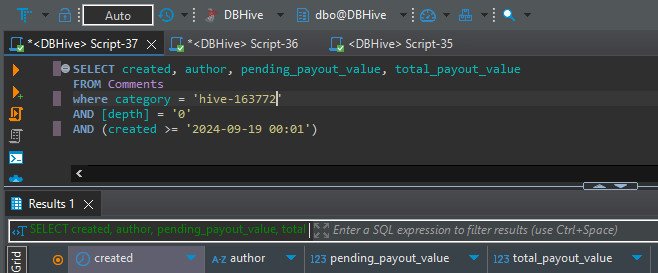 *SQL query to get every post on a given Community during the last month (Worldmappin in this case)*
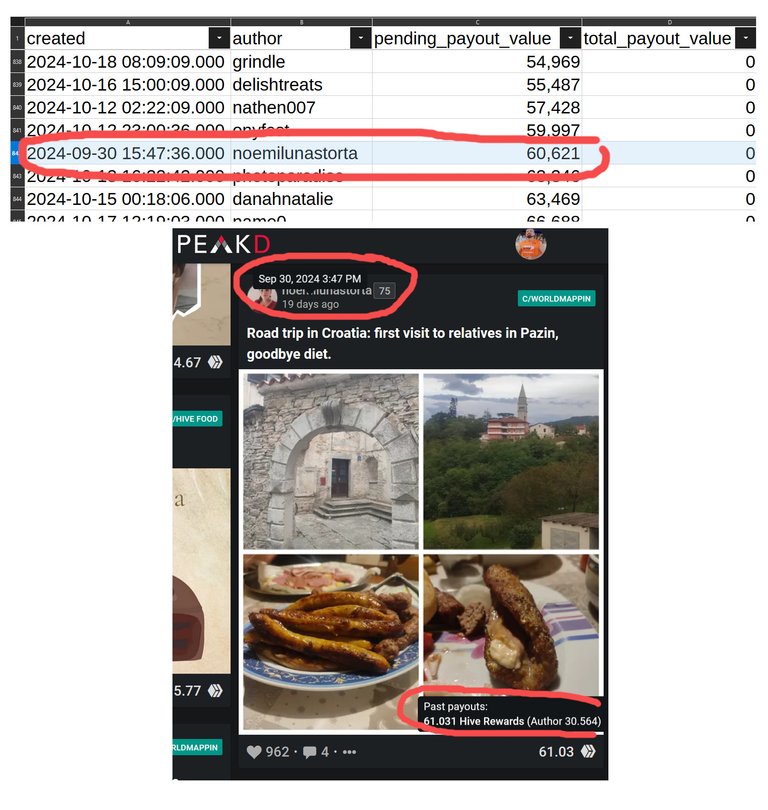
In @HiveSQL all posts have, among many other data, “pending payment” (pending_payout_value) and “total payment” (total_payout_value). Posts less than 7 days old have “0” in the "total payment" field and the "rewards" amount in "pending payment", since they have not received payment for that post. Conversely, posts older than 7 days have the amount the author received in "total payment" field and “0” in the "pending payment".

 *Both screenshots from [HiveSQL](https://docs.hivesql.io/)*
That “rule” has some exceptions for reasons unknown to me: Some posts older than 7 days, still reflect the amount in the “pending payment” field, even though the post is past the date of issuing payment to the author and curators, as was the case with this post of a trip to Croatia.
With all this information, I can compare the top 5 communities by revenue, taking into account the number of authors and the post number.
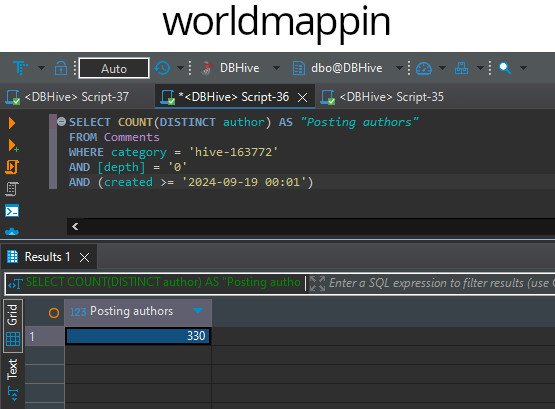
Another interesting fact is that in Worldmappin 330 users posted, while in Leofinance 702 users posted, but achieved lower collective revenues. In addition, HiveCN managed to get into 4th place in terms of revenue with only 65 users posting, while 5th place goes to HolozingCommunity with posts from 150 different users.
Among all those users posting in the top 5 communities, I decided to sort the top 10 by revenue generated within each community and the top 10 by post volume.
This is the top 10 users by revenue for the last month within each of these communities.
This is the top 10 users by number of posts in the last month within each of these communities.