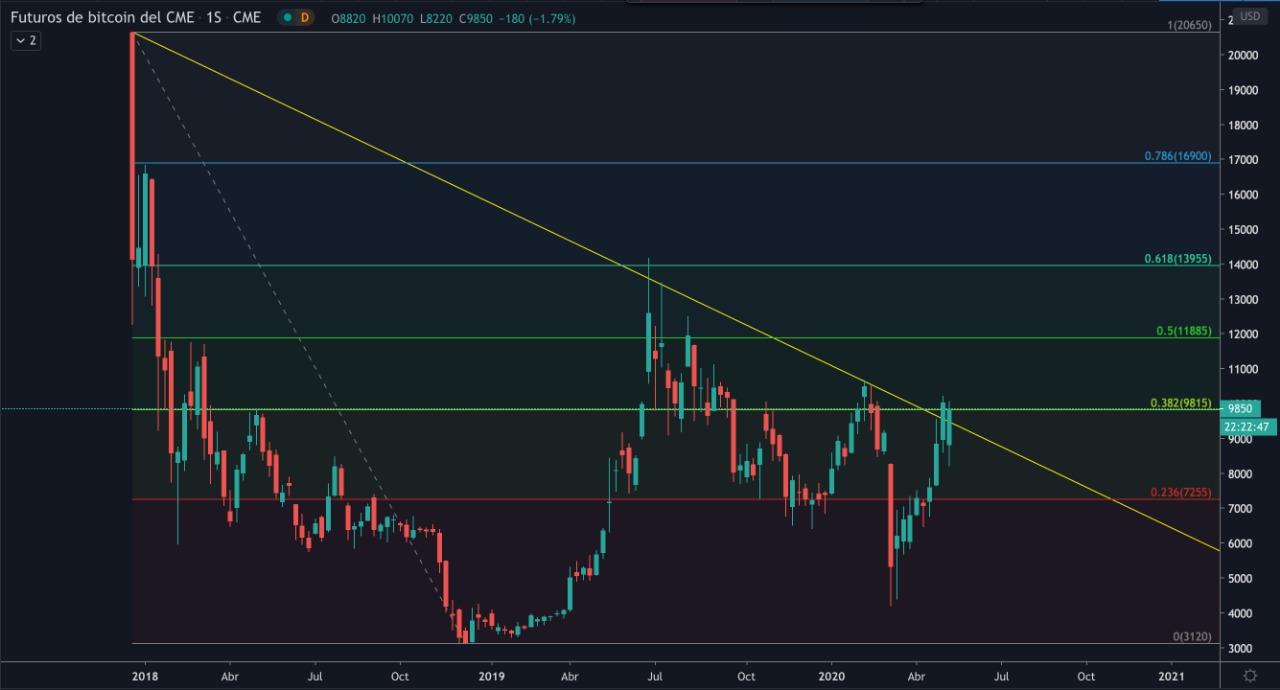
This is BTC-USD weekly CME futures chart.

Let's look at how the price of bitcoin is at a critical point since it is currently breaking the downtrend line (yellow) that has been in effect for years. The BTC price level of USD 10500-10600 is the target to break, a maximum previously reached. If we chart a Fibonacci retracement from December 2017 high to December 2018 low, the next level to break on this chart is at $ 11,885.
If the price of the main cryptocurrency can touch, exceed and close above USD 14,000, it is when it begins to be bullish in all periods. The price could easily hit new highs once it exceeds that $ 14,000 level as there won't be as many sellers.
The concepts and descriptions in this note are my opinion and do not constitute an investment recommendation.
Last posts
- Norway to Cut Taxes on Crypto Mining
- The US Department of Defense will protect your data with blockchain
- Bitcoin is the gateway to altcoin trading
- Investing in beer Is it a good opportunity in the stock market now?

Posted Using LeoFinance
10500$ magic level
Posted Using LeoFinance