
Hey team,
I didn't publish a blog yesterday because I had been stalking USD/JPY all weekend and then when we got to Monday the price action was somewhat lacklustre to say the least.
With USD/JPY at daily resistance and back in play, I wanted to see some sort of a sustained move out of the zone but markets rarely behave how you want them too and this was no exception.
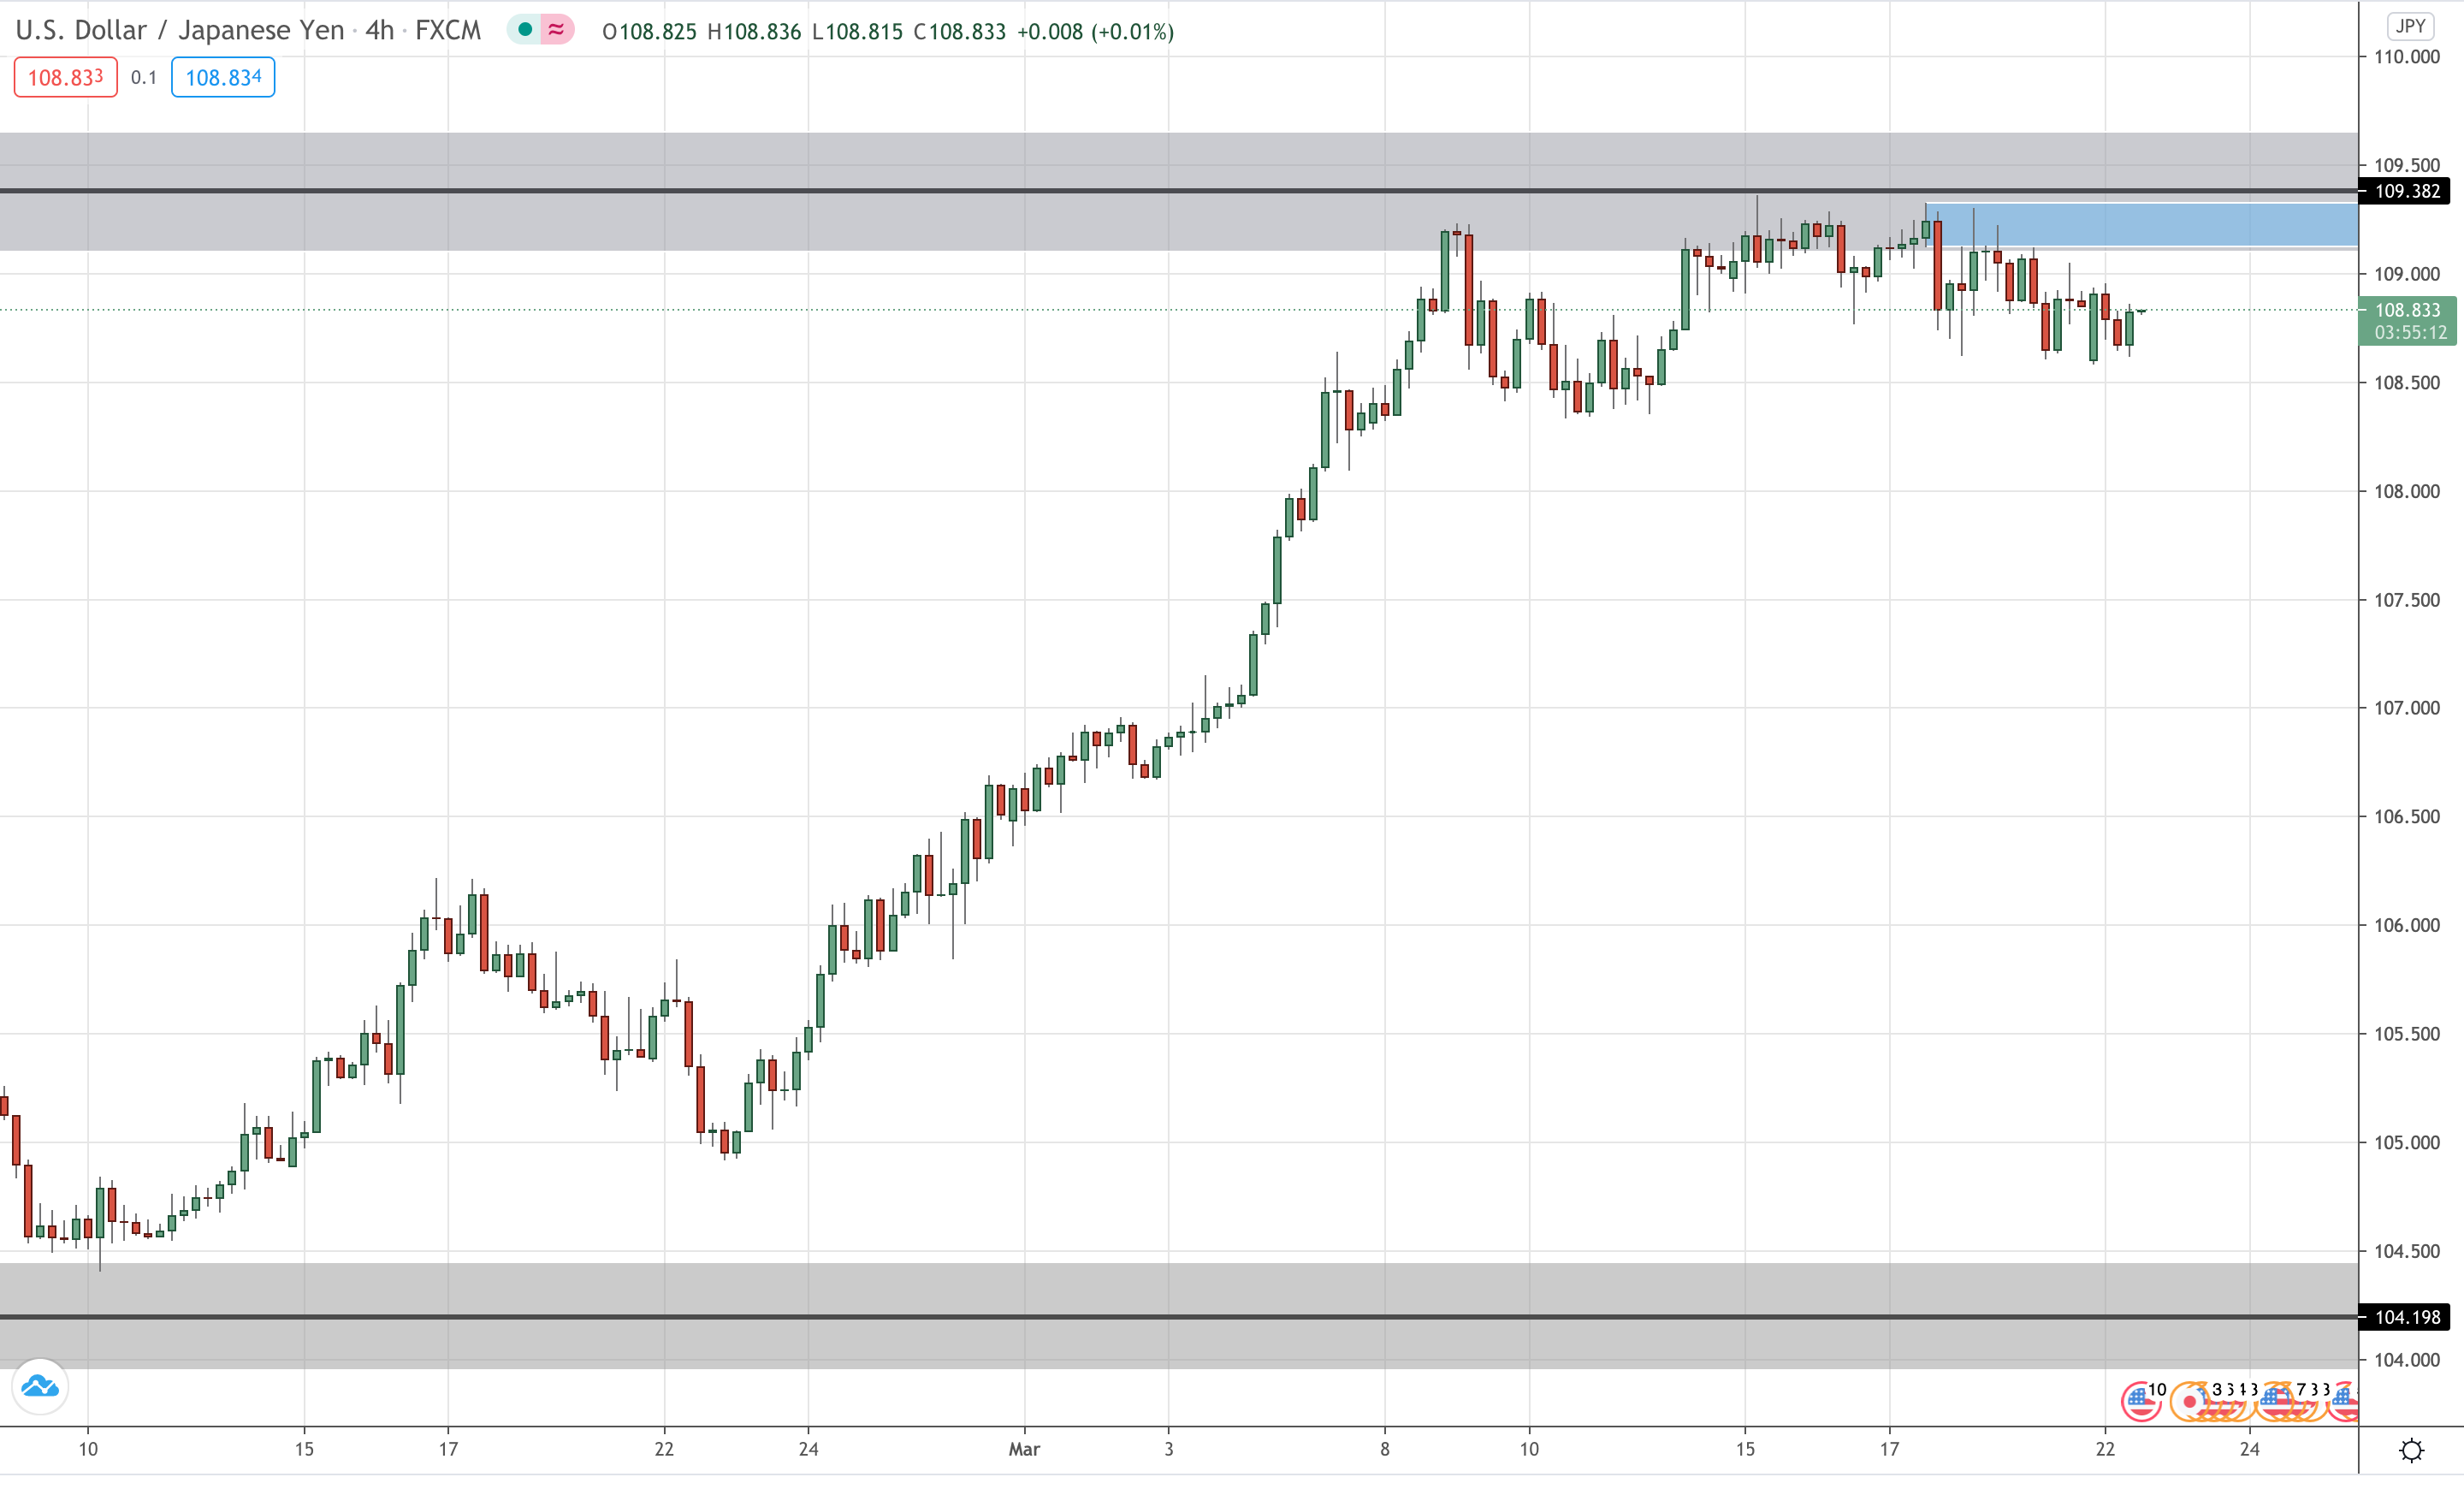
Take a look at the latest price action on the USD/JPY 4 hourly chart below.
USD/JPY 4 Hourly:

Remember that the grey is the daily resistance zone which I highlighted in the last blog (linked back to at the top).
With price being below higher time frame resistance, I only want to take trades from the short side.
Why fight the tide if we don't have to, right?
So after price pushed back below the daily zone, I take the last area of short term support that when retested as resistance, acts as a short signal.
This puts both the higher time frame and intraday time frames in sync and gives us the highest probability of price immediately falling without any drawdown on my entry.
My simple forex support and resistance trading strategy has more details on how I trade and what the jargon in my LeoFinance daily market analysis blogs are all about.
Now drop you mongrel!
Best of probabilities to you,
Dane.

FOREX BROKR | LeoFinance Blog
Daily market analysis.
Posted Using LeoFinance Beta
Felicitaciones por el analisis. Tanto tu analisis, como los que estan en los comentarios, preveen un mercado bajista a corto plazo para el par USD/JPY. Te comparto el mio, donde llegamos a la misma conclusion.

Saludos.
Posted Using LeoFinance Beta
It's just a little concerning that if everyone is looking at the same thing, then the smart money will take advantage of the liquidity created and do the opposite.
We just have to manage our risk and stay nimble.
Posted Using LeoFinance Beta
Source
We are still in a horizontal direction since the beginning of the month
But in the short term, I expect the price to correct down again
Posted Using LeoFinance Beta
Thanks for sharing your USD/JPY chart :)
I share similar thoughts to you.
But just make sure that if you're shorting, that you manage your risk and are able to get out/flip to longs if the market continues higher.
Posted Using LeoFinance Beta
Of Course
I think we are all expectantly waiting for the same thing mate hahaha.
In my personal opinion, I believe that USD/JPY should break below the support at 108 for a more forceful fall to the 105 - 104.40 support area.
We will see what the price does, the markets in the end do what they want hahaha. Greetings colleague!
Posted Using LeoFinance Beta
Haha but if it's too obvious, the market will probably not give us what we want.
Just make sure we're managing our risk and it's all good :)
Posted Using LeoFinance Beta
Exactly hahaha. Good luck my friend!
Posted Using LeoFinance Beta
so the big drop is the way to mark the resistant zone isn't it?
as my marking is a bit different than yours in the previous post.
nice another lesson learn. ;)
Posted Using LeoFinance Beta
In all my charts, the grey zone is resistance on the daily chart which I call 'higher time frame resistance'. The higher the time frame (so daily, weekly, monthly), the more important it is.
The grey zone on that chart is drawn because the sellers rejected it big, multiple times. The following chart and my thoughts are in this blog:
After I've determined whether price is above or below higher time frame resistance, then I zoom into an hourly chart to look for an entry like I have in this particular blog.
Posted Using LeoFinance Beta