Pivot Points, Resistances and Supports from Pivot Point Trading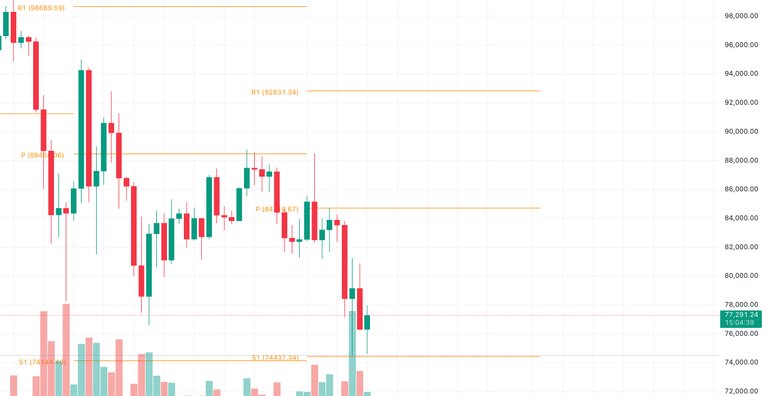
Pivot point trading was developed by floor traders in the early 20th century, but it is not clear exactly who invented it.
It executes technical analysis to calculate pivot points, resistances, and supports. The pivot point is the average of the low, high, and closing prices from the last period. From this pivot point, supports and resistances are derived using a calculation equation. Generally, traders may use the supports, resistances, and pivots as entry, exit points, or stop-loss levels.
- Pivot Point = (High + Low + Close) / 3
- R1 = (2 x PP) - Low
- S1 = (2 x PP) - High
Pivot Point is an indicator that uses past data, meaning the predictions may not always be correct. It is known that pivot points are especially weak in very volatile markets or instruments. Therefore, traders should combine other indicators, such as RSI and MACD (momentum indicators), tools, or fundamental analysis.
Pivot point trading is suitable for fast and simple trading in liquid markets and works well in range-bound markets. It is still used by algorithms and market makers that have it coded into their systems. However, the asset market is rapidly evolving, becoming more volatile, complex, and news-driven, so this simple pivot point trading may miss important context. Additionally, it does not consider volume, which could be a significant weakness.
Recent backtests show that the win rate of pivot point trading is under 50%. The win rate ranges from 44% to 49% across Forex, S&P Futures, and large-cap equities. Therefore, it will be more viable to apply it in combination with other tools and price action.
This post is also published on Medium on April 9, 2025, by the same author.
Posted Using INLEO