In my previous blog post I wrote about flat eart5h debunkers being sloppy with te footage they use to show the earth is round and with their responses to flath earhers pointing out that some of the footage is computer edited.

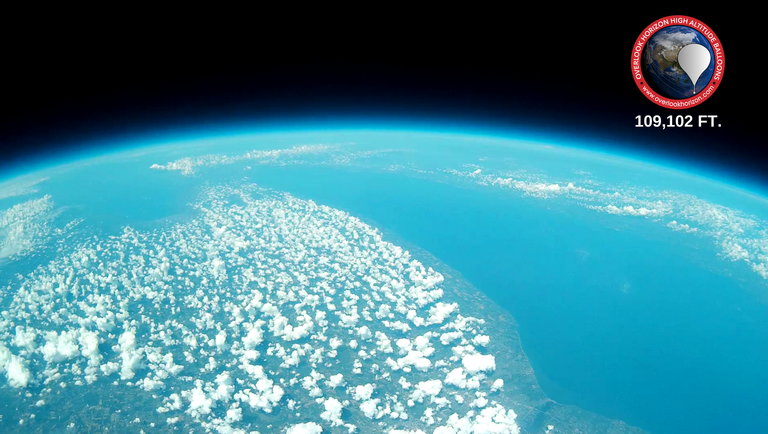
This post isn't about flath earth debunkers, and this image isn't from any of their videos, I picked this image from this site because the image shows quite some curvature AND it shows the altitude. As @eniolw pointed out, I need to disclose the source of what I'm saying even if the source is mostly simple highschool level math. Making it vissible with a bit of python though should prove enlightning to some.
Before we start off, look at the image above. It is real photograph, but do you think this is what our planet looks like from a height of 109,102 ft? Well, that is what we are going to look at in this post.
Imagine a straighline from the horizon on the left of the image to the horizon on the right of the image. Now from the center of that line, imagine a line hoing up to the horizon in the center. Now if we divide the length of the short line by the length of the long line, we get a number for the relative curvature visible in this image.
In this image, this number comes out at about 0.06, so lets see how realistic that is at the given altitude.
I'm writing this blog post using jupyter notebook, a great tool that allows me to mix markdown with working python code, a great tool for writing STEM related blog posts.
We argoing to use a powerfull little library called numpy that will allow us to do the calculation for a range of heights at the same time. Lets import numpy a d two other libraries we shall be using.
import numpy as np
import math
import matplotlib.pyplot as plt
Imagine our camera is exactly above the north pole, and we are interested in the curvature between two points at the horizon. One at the extreme left of our image, and one at the extreme right. Because we are at the north pole exactly, we know the latitude or rather the difference in latitude for both points is going to be the same. We don't know what it is yet, but we know it is going to be the same. The longitude is detemined by the horizontal viewing angle of our lens. Let us define a simple function that takes a numpymarray of lattitudes and calculates the great circle distance between the two points on the horizon.
def great_circle_distance(latitude, longitude2):
    return np.arccos(np.sin(latitude)*np.sin(latitude) + np.cos(latitude)*np.cos(latitude)*math.cos(math.radians(longitude2)))
Please note the calculated distance is in radians, not miles or km.
Because we have a relative curvature in our image of 0.06, the ratio between the short line and the long line from before, lets make a simple function that calculates exactly that. For that we divide our angle distance in two and use some basic sin and cos math to calculate the line lengths.
def relative_curvature(latitude, longitude2):
    dist = great_circle_distance(latitude, longitude2)
    depth = 1 - np.cos(dist/2)
    width = 2*np.sin(dist/2)
    return depth / width
So far so good, but we dont have our latitudes yet. And we need a starting point: the height of our camera.
We make thirt function that needs to convert an actual height of our camera to a latitude. Again we are going to use a numpy array to work with as height rather than a single value.
In this function we normalize our height to a planet with a radius of one to make the math simple. This gives us a normalized triangle where our horizon is 1.0 from the ce tenter of the planet, our relative height is the long arm of the triangle, and we can use pythagoras to find the length of the short arm.
At a planet radius of 1.0, the length of our short arm will be equal to the tan of 90 degrees minus the latitude of our point at the horizon, so we take the arctan of our relative line of sight length and subtract it from 90 degrees but in radians.
def height_to_latitude(height):
    earth_radius = 6371000
    relative_height = (height + earth_radius)/earth_radius
    line_of_sight = np.sqrt(relative_height * relative_height - 1)
    arc_of_sight = np.arctan(line_of_sight)
    return math.radians(90) - arc_of_sight
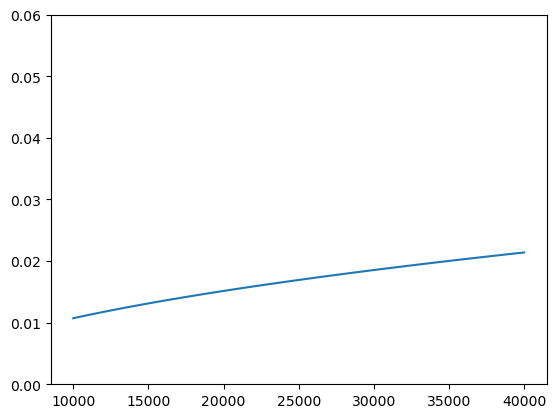
Now let us have a quick look at where we expect things to end up if this is a regular weather balloon flying at regular weather4 baloon height, using a normal linear lens with minimal lens distortion. We should be at 109,102 ft or 33,254 meters altitude, so lets look at the 10km, and let's assume a 100 degree horizontal viewing angle and see how close we are to the relative curvature of 0.06.
height=np.linspace(10000,40000)
curvature = relative_curvature(height_to_latitude(height),100.0)
plt.ylim(0, 0.06)
plt.plot(height, curvature)
plt.show()

Not exactly what we were expecting, even at 40 km the relative curvature would beonly about one third of what we are oberving.
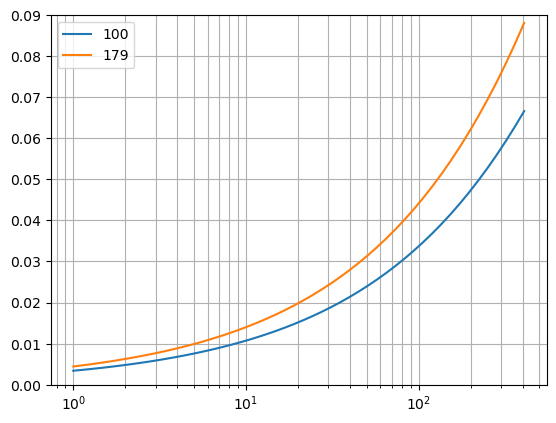
Let us add a wide angle camera to the mix, we look at both 100 degrees and at 179 degrees, and we look at the expected relative curvature for both a linear lens and a software corrected image from a wide angle lens. The following function, using a log x axis ranging from an altitude of 1 km upto the altitude of the ISS.
def plot_for_angles(angle, angle2):
    height = np.logspace(3,5.611)
    c = relative_curvature(height_to_latitude(height),angle)
    c2 = relative_curvature(height_to_latitude(height),angle2)
    plt.grid(True, which="both", ls="-")
    plt.ylim(0, 0.09)
    plt.semilogx(height/1000, c, label=str(angle))
    plt.semilogx(height/1000, c2, label=str(angle2))
    plt.legend()
    plt.show()

plot_for_angles(100, 179)

If we look at the graph, we see that even with a wide angle lens, given the image is software corrected for lens distortion, we would expect a relative curvature below 0.03 in our image at this altitude. Instead at 0.06 we see an aparant curvature matching a height somewhere between close to 200 km assuming wide angle and more than 300 km assuming a lineair lens.
This means this image is most certainly taken using a wide angle camera and no correction for lens distortion has been made on the resulting image. This does't mean that the earth is somehow flat, it just means that the earth is much bigger than the curvature of this immage may imply. This image should have been edited with software that can correct for lens distortion. Unedited balloon footage doesn't usually show a reliable depiction of the earths curvature.
Flat earth folks hear computer editing of the curvature and think this means the images are CGI and fake and the earth is actually flat. Under informed flat earth debunkers like Professor Dave hear flat earthers say CGI and comouter eddited and simply claim the photos and videos are fine and untouched, underrmining their own arguments and making flath earthers look credible.
I believe the math is simple enough, that the subject of software lencorrection is simple enough for flath earth debunkers to actually adress without undermining their own arguments and making flat earhers look credible in the process.
To close of this post, lets look at what the actual curvature would look like at 109,102 ft.

There is a tiny bit of curvature there. if you ca t see it use a piece of paper, but the curvature is very minimal at this height.
Thank youi for your update and examples using Python.
I'm not sure how you derived that conclusion, but my earlier comment wasn't about your math. I was actually pointing out that it would help if you linked to the specific claims made by Professor Dave that you're questioning. It's all about backing up what we say with evidence so people can see for themselves and we can keep things credible.
Also, I noticed you're making a sweeping statement about Professor Dave's work based on one issue. But without showing us the error and its context, it's tough to take that leap. I'm going to assume there's been a mix-up with what I said before, but let's try to avoid feeding the haters without a good reason.
Thanks for your contribution to the STEMsocial community. Feel free to join us on discord to get to know the rest of us!
Please consider delegating to the @stemsocial account (85% of the curation rewards are returned).
You may also include @stemsocial as a beneficiary of the rewards of this post to get a stronger support.
Thank you for your witness vote!
Have a !BEER on me!
To Opt-Out of my witness beer program just comment STOP below