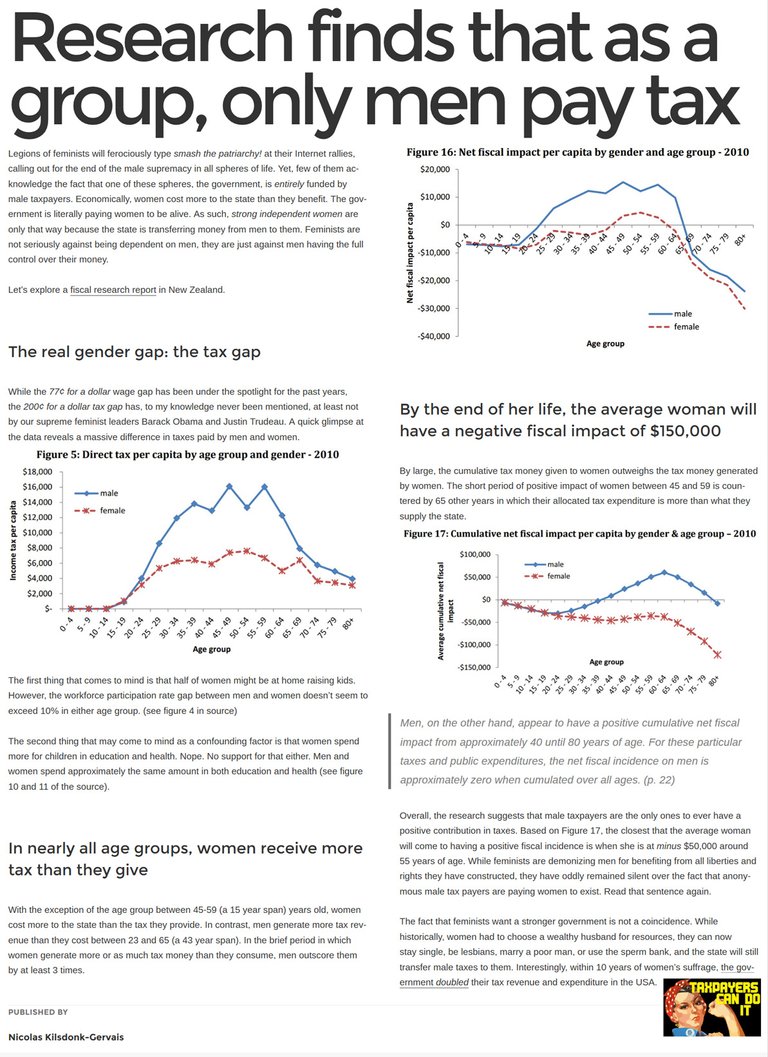
To respond to your other question, the source of the chart is data from the government of New Zealand, which is where that particular study was sourced:

http://imgur.com/gallery/3lWlM
"Research finds that as a group, only men pay tax."
"In nearly all age groups, women receive more tax than they give."
The quotes you give have nothing whatsoever to do with the new Zealand government, and you know it, and purposefully try to mislead. The graphic is one thing, the wacko interpretations is another thing entirely. Claiming that women don't pay taxes is laughably stupid. There is no source to be found, you have given a link to an image with misogynist text. Fishy, and easy to see through.
Did you notice your whole argument was fallacy? Since you didn't bother to read anything, you are just blathering on like a fool.
First, you deny reality which has already been cited to you. Then, you move on to ad-hominem by deeming anything you disagree with is "misogynist" (apparently facts are misogynist), and finally you finish with an amateur straw man.
Your Machiavellian technique is not bad, but it won't work against a talented debater.
The source is the government of New Zealand, which you'd know if you looked it up. It says it right on the page, after all.
Women do not pay taxes net of benefits. They claim more benefits than they pay. This, too, is a fact that you choose to ignore.
It says this right in the study.
You are deliberately trying to confuse "no taxes" with "no net taxes" in an attempt to use a straw man fallacy against me. It will not work.
Ok, you are making a lot of claims, with no proof. I read the bullshit article. It has no link, no webpage. The words on the image are not from the new Zealand government.
That text is not a study. There is no reliable link to an interpretation of that graph,it's just a graph. You call me a fool?
You are the one making unfounded claims. You are a liar, manipulator, misogynist, a fool, and a piece of shit.
Aren't we getting feisty as the lies you've built your ego and self-worth around come crumbling down?
You're just denying the citations over and over again. Reality denial is a poor source of debate.
Here is the conclusion from the study: " whilst working age men contribute significantly more taxation and receive less income support than their female counterparts"
Here is the citation:
Omar Aziz
Government of New Zealand - Treasury
Norman Gemmell
Victoria University of Wellington - Victoria Business School
The Distribution of Income and Fiscal Incidence by Age and Gender: Some Evidence from New Zealand
You'll notice figures 5 and 6 on page 14, that prove that I am 100% correct, and that you are merely a cognitively dissonant mudslinger.
If you manage to accept this information without sputtering another sequence of 5 unfounded ad-hominems in a row, I know what you will do next. You will simply attack the study as being simply one country, one data point, etc. You would hypothetically have a point, so let's take care of that next.