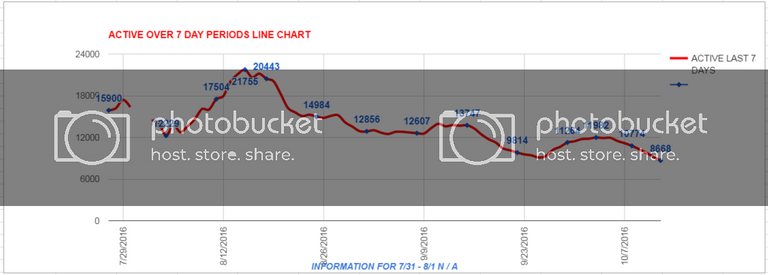
10 / 12 / 2016 - 8:52 AM EST STEEMIT NEWS FLASH : Active last 7 days daily line chart ( chart # 1 )
Active users last seven days continue to decline .
I like applying data to charts . By applying data to charts it can reveal a much clearer picture .
CHART # 1 LINE CHART DAILY
RED LINE = Active last 7 days DAILY

CHART # 2 COLUMN CHART WEEKLY
RED COLUMN = Active last 7 days WEEKLY

DISCLAIMER : This content is for informational, educational and research purposes only.
Please get the advice of a competent financial advisor before investing your money in any financial instrument.
It is strongly recommend that you consult with a licensed financial professional before using any information provided here at STEEMIT NEWS FLASH . Any market data or news commentary used here is for illustrative and informational purposes only.
Please voice your opinions in the comments below.
If you find any of this information useful to you. Please upvote and follow. THANK YOU
Did you notice this potential bullish engulfing pattern?
maarnio I had not noticed it but just looked and it at this time has disappeared
Thanks for all your comments and support
Yep. Let's wait until the close of the day.
nice
RESTEEMING