This week we have a lot more information on the ** STEEMIT WEEKLY DATA REPORT** So let's dig right into some of the data. The spreadsheet below is of a Steemian whose name I will keep confidential . This Steemian has not been active for over 4 months . I choose this account to illustrate the rate his SteemPower is growing . Also to illustrate how his account has dramatically fell in value . Over just 31 days .
SPREADSHEET
Daily Changes
....Date...................Steem Power.................... Estimated Value
2016-09-01........ 401786.141 (0.58%).......... $422679 (-4.71%)
2016-08-31........ 399472.152 (0.58%).......... $443554 (-4.16%)
2016-08-30........ 397164.602 (0.59%).......... $462800 (32.09%)
2016-08-29........ 394851.239 (0.59%).......... $350371 (-6.54%)
2016-08-28........ 392549.760 (0.59%).......... $374885 (1.77%)
2016-08-27........ 390256.389 (0.59%).......... $368347 (-11.68%)
2016-08-26........ 387966.172 (0.59%).......... $417079 (-17.95%)
2016-08-25........ 385699.379 (0.60%)......... $508329 (4.03%)
2016-08-24........ 383397.671 (0.60%).......... $488636 (-14.72%)
2016-08-23........ 381101.676 (0.60%).......... $572979 (-5.90%)
2016-08-22........ 378810.667 (0.61%).......... $608927 (1.98%)
2016-08-21........ 376521.378 (0.61%)......... $597095 (-1.23%)
2016-08-20........ 374224.145 (0.61%).......... $604559 (9.84%)
2016-08-19........ 371945.472 (0.62%).......... $550409 (-2.55%)
2016-08-18........ 369647.005 (0.63%).......... $564821 (8.66%)
2016-08-17........ 367339.856 (0.63%).......... $519786 (-13.57%)
2016-08-16........ 365043.733 (0.63%).......... $601410 (-1.26%)
2016-08-15........ 362744.987 (0.63%).......... $609060 (-0.02%)
2016-08-14........ 360456.594 (0.64%).......... $609175 (11.16%)
2016-08-13........ 358165.725 (0.65%).......... $548019 (-0.59%)
2016-08-12........ 355863.969 (0.65%).......... $551297 (-13.84%)
2016-08-11........ 353573.812 (0.65%).......... $639841 (-10.93%)
2016-08-10........ 351273.366 (0.66%).......... $718372 (-3.48%)
2016-08-09........ 348982.758 (0.66%).......... $744303 (-12.10%)
2016-08-08........ 346688.723 (0.66%).......... $846787 (10.01%)
2016-08-07........ 344399.030 (0.67%).......... $769732 (-3.66%)
2016-08-06........ 342109.694 (0.67%).......... $798939 (5.41%)
2016-08-05........ 339820.731 (0.67%).......... $757953 (-6.90%)
2016-08-04........ 337547.111 (0.69%).......... $814164 (-1.08%)
2016-08-03........ 335247.975 (0.69%).......... $823044 (-10.44%)
2016-08-02........ 332959.994 0.000............. $918966
WHY POWER UP
After studing this spreadsheet you can see that the rate of SteemPower increase is gradually falling . The rate of increase per day started at 0.69% on 8 / 2 / 2016 and on 9 / 1 / 2016 is at 0.58% . This rate per day will continue to fall proportionately until it stabilizes some where around 0.176% to 0.25% per day . That should happen come April 2017 .
This Steemian's SteemPower went from 332959.994 to 401786.141 that is an increase of 68826.147 SteemPower in 31 days or a 20.67% increase in this steemin's SteemPower .
WHY NOT TO POWER UP
By continued study of the spreedsheet above under Estimated Value we see this ateemin's account value on 8 / 2 / 2016 at $918966 and on 9 / 1 /2016 is at $422679 . That is a decrease in value of $496287 or a 54% fall in value in just 31 days . I will talk more about this in the summary at the bottom of this report .
Study the chart below.
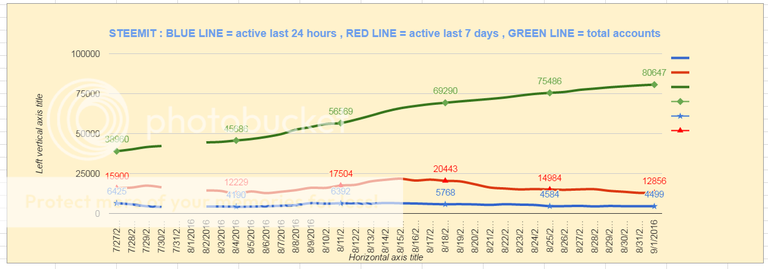
In my report 2 weeks ago I wrote :
One of the big problems i'm seeing as an investor is the Blue Line. The Blue Line is active users over 24 hour period. You can see by the chart above on 7 / 27 / 2016 active users were 6425 and on 8 / 19 / 2016 active users were 5832. Thats over a 9% drop in 23 days . Also notice the Blue Line is relatively flat. I'm not exactly sure what qualifies as an active user. I would think it is a user who either posts , comments , or votes . The active users should be increasing .
Now some GOOD news: The Green LINE is total accounts. Total accounts have skyrocketed from 38960 to 70149 in only 23 days. That's an increase of over 80% in just 23 days. This will blow your mind if STEEMIT grows new members at 80% a month over month for one year. Are you ready for this figure: 81,150,564 over 81 million STEEMIT members in one year.
Last weeks report :
The Green Line continues to rise this is good news total accounts increased from last week 8 / 19 / 2016 was 70149 this week 8 / 26 / 2016 is 76078 that is an 8.45% increase over last week .
The Blue Line continues to fall . This is bad news . Active users over 24 hour period decreased from last week 8 / 19 / 2016 was 5832 . This week is 4597 : That is a decrease of 21.17% from last week .
The Red Line also continues to fall . This is bad news . Active users over a 7 day period decreased from last week 8 / 19 / 2016 was 20084 . This week is 14811 : That is a decrease of 26.25% from last week .
This weeks report
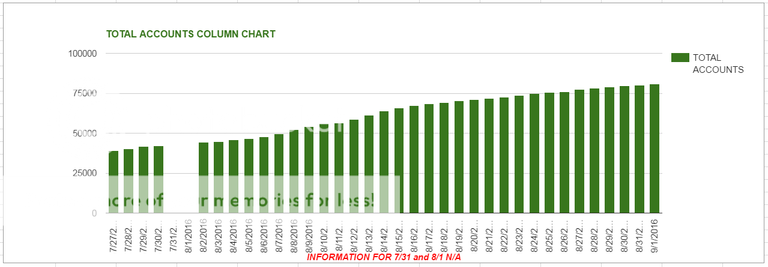
The Green Line continues to rise this is good news total accounts increased from last week 8 / 25 / 2016 was 75486 this week 9 / 1 / 2016 is 80647 that is a 6.83% increase over last week .
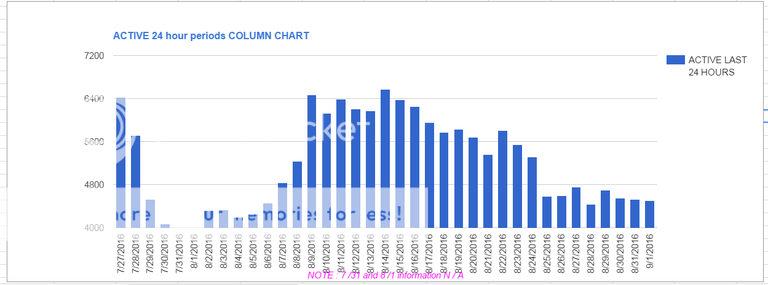
The Blue Line continues to fall . This is bad news . Active users over 24 hour period decreased from last week 8 / 25 / 2016 was 4584 . This week is 4499 : That is a decrease of 1.85% from last week . The GOOD NEWS here is the percentage fall this week from last week has slowed considerably .
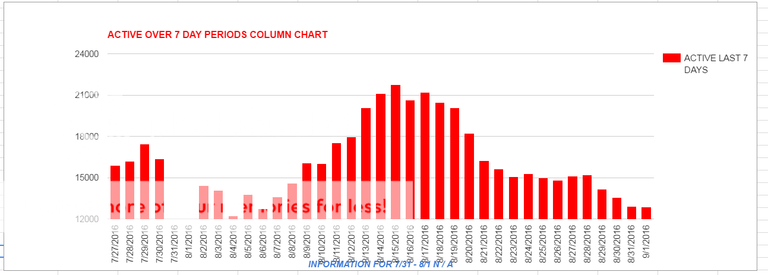
The Red Line also continues to fall . This is bad news . Active users over a 7 day period decreased from last week 8 / 25 / 2016 was 14984 . This week is 12856 : That is a decrease of 14.20% from last week . The GOOD NEWS here is the percentage fall this week from last week has slowed considerably .
Below column chart active over 24 hour periods.
Below column chart active over 7 day periods.
Below column chart of total accounts
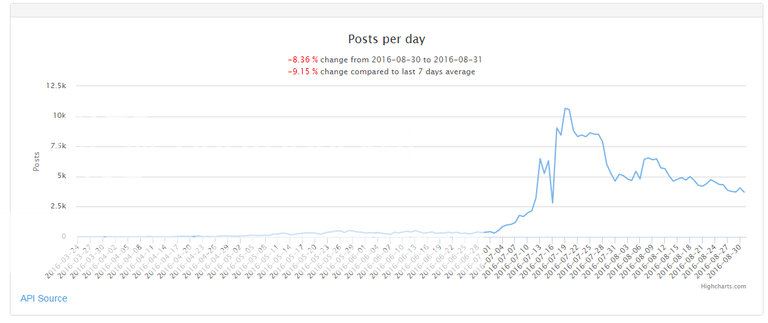
Posts per day below :
image credit steemle.com
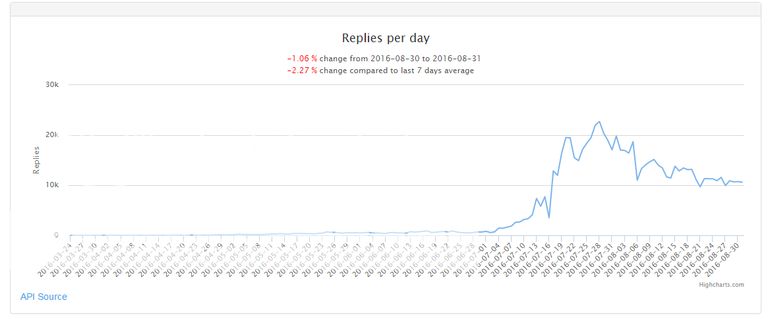
Replies per day below :
image credit steemle.com
STEEM not invested in SteemPower henceforth referred to as : LIQUID STEEM
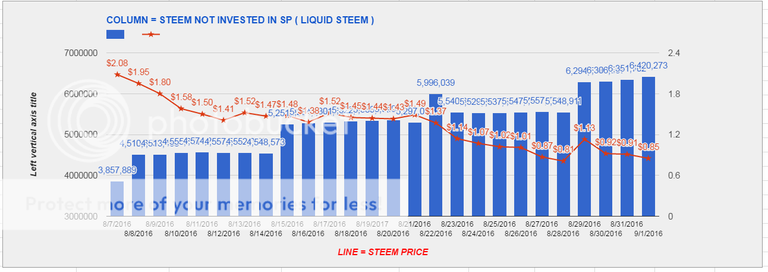
Total Liquid STEEM numbers on 8 / 25 / 2016 were 5,537,524 today as of this writing are 6,420,273 a week over week increase of 882,749 . That is a 15.94 percent increase of Liquid STEEM .
Study closely the spreadsheet and charts below.
GLOSSARY OF SPREADSHEET TERMINOLOGY :

Current_Supply = ...Current supply of STEEM
Total_Vesting_Fund_ Steem =... Total STEEM invested in SteemPower
Total_Vesting_Fund_ STEEM AS % of CURRENT SUPPLY =... Total STEEM invested in SteemPower as a % of total steem
STEEM NOT INVESTED IN STEEM POWER =... Total number of steem not invested in SteemPower ( LIQUID STEEM )
NUMBER of STEEM not invested in SteemPower daily increase or decrease =... The daily increase or daily decrease of steem not invested in SteemPower
STEEM PRICE BTC - STEEM =... Price of steem to btc on Bittrex
STEEM PRICE $$$$ - STEEM = Price of steem in $ dollars on Bittrex
SBD PRICE $$$$ - SBD = Price of sbd in $ dollars on Bittrex
In chart # 1 below you can see the STEEM price as the red line and the total number of LIQUID STEEM as the blue column.
CHART # 1
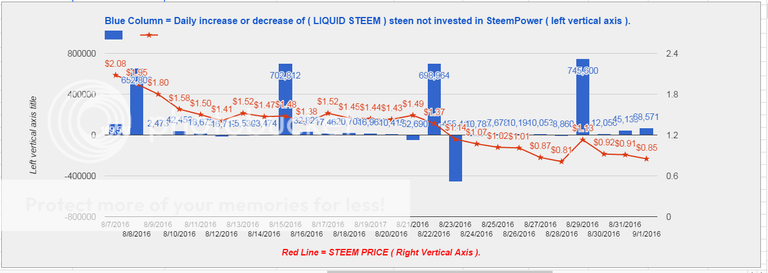
In chart # 2 below you can see the STEEM price as the red line and the daily increase or decrease of LIQUID STEEM as the blue column.
CHART # 2
** VESTS**
8/24/2016 : 1 MV = 1M VESTS = 294.057 STEEM = $424.618
8/25/2016 : 1 MV = 1M VESTS = 295.862 STEEM = $419.533
8/26/2016 : 1 MV = 1M VESTS = 297.698 STEEM = $390.877
8/275/2016 : 1 MV = 1M VESTS = 299.355 STEEM = $339.170
8/28/2016 : 1 MV = 1M VESTS = 301.051 STEEM = $329.952
8/29/2016 : 1 MV = 1M VESTS = 302.876 STEEM = $296.818
8/30/2016 : 1 MV = 1M VESTS = 304.633 STEEM = $287.269
8/31/2016 : 1 MV = 1M VESTS = 306.396 STEEM = $286.481
9/01/2016 : 1 MV = 1M VESTS = 307.721 STEEM = $282.180
SUMMARY :
Total accounts increased 6.83% over last week that is not as good as the week before's 8.45% week over week increase .
Active users over 24 hour period decreased 1.85% from last week. That is much better than the week before's 21.17% week over week decrease . This to me is hopeful .
Active users over a 7 day period decreased 14.20% over the last 7 days. That is much better than the week before's 26.25% week over week decrease .
Total Liquid STEEM numbers on 8 / 25 / 2016 were 5,537,524 today as of this writing are 6,420,273 a week over week increase of 882,749 . That is a 15.94 percent increase of Liquid STEEM .
I said I would say more about the 54% decrease in the steemin's account even though the account gained over 20% in SteemPower . This is because the price of steem has fallen from over $2.00 to $0.85 in this 31 day time frame .
DOES it all in the end come down to the price of steem ?
We will continue to monitor these numbers and keep you updated here at STEEMIT WEEKLY DATA REPORT.
Remember to make steem you have to boil water !!!
DISCLAIMER : This content is for informational, educational and research purposes only.
Please get the advice of a competent financial advisor before investing your money in any financial instrument.
It is strongly recommend that you consult with a licensed financial professional before using any information provided here at STEEMIT WEEKLY DATA REPORT . Any market data or news commentary used here is for illustrative and informational purposes only.
Please voice your opinions in the comments below.
If you find any of this information useful to you. Please upvote and follow. THANK YOU
Nice report thank you.
glad you liked it warrensteem
How close is the correlation between change in liquid Steem and price?
dennygalindo as of present time we are 95.57% of steem invested in steempower .I read a post the other day and they were saying that steem not invested in SP should drop to 90% . And that would mean a lot more Liquid Steem .As for correlation between change in liquid Steem and price . The Liquid Steem has been steadily growing and as you can see the price of steem keeps falling .
Can you put the daily %chg in liquid Steem in one column and the daily pct change in Steem price in one column then use the excel Corel function to calc the correlation?
Good report, thanks for the time and effort that goes into compiling it.
sbq777t I put most of this together for myself . But to put it all together and post it on here does take a lot of time .glad you appreciate it
It looks like the price of steem in vital
yes otisbrown I think the price of steem is key
Very nice report! Well done. Following.
Thanks lukestokes I have been following you just recently and your posts are very good .
Thank you for the compliment! Much appreciated.
your welcome and deserving of the complement .
Very well done me-tarzan you presented a lot of good information here . And thank you for taking the time to help us understand more about how this all works .
Thank you for the compliment spinbunny
...the rate of SteemPower increase is gradually falling... thanks for that i wasnt sure about this number.
Hi elyaque ya I was not sure myself so I started researching it .
Great Report
💋 @halo 💋😇
Hi @me-tarzan i didnt find you in the Chat, i like to mention yo tomorrow in my daily Report. Please PM me in the Chat, thanks