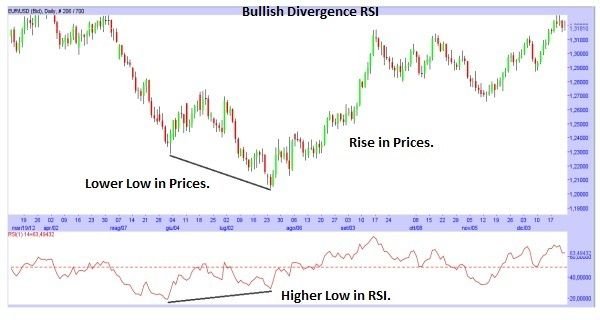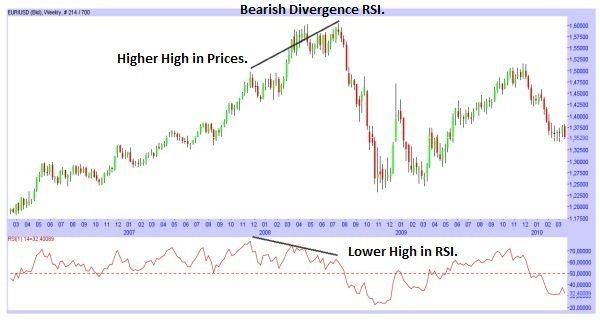
RSI is an indicator that compares upward and downward movements in closing price over a period of time of your choice. As with any indicator traders use RSI in many ways. One of the most popular ways is to go long when RSI moves below a value of 40 and then rises above it.

In a downtrend, a short signal is when RSI moves above 60 and then moves back below it.

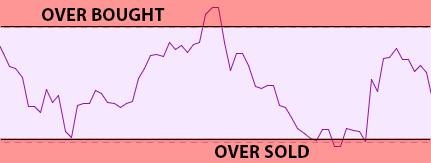
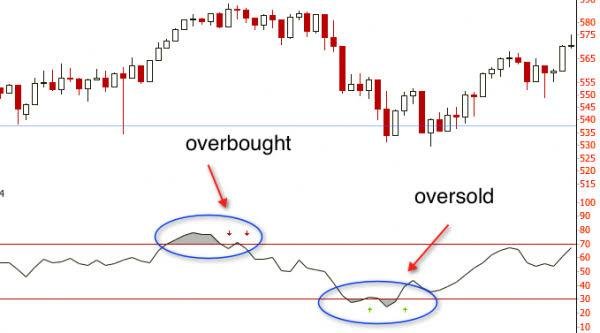
Usually, RSI is considered overbought when above 70 and oversold when below 30.

I hope this quick post help you understand what RSI is and you can use it on your next trade... Thanks for reading and...Happy Trading!!!
click here!This post received a 1.5% upvote from @randowhale thanks to @krypto101! For more information,
Interesting post... how often do you utilize these kinds of momentum oscillators when making trading decisions? Sometimes, I like to consider the movements of the MACD and signal lines in the stochastic oscillator at the bottom of the charts on Poloniex, but I don't generally allow their movements to sway my opinion for a particular trade.
Do you create your own charts or do you stick to the charts provided by whichever exchange you may be using at the time?
Thanks for making me aware of this investing tool! looking forward to getting to know some others with you.
They are on my screen 24/7...its a must have
Interesting, I seem to have been able to find quite a bit of success with minimal use of such analytics. To each his own I suppose.
Absolutely, although i recommend RSI and MACD, surer easy to use and can save u a ton
I feel you on the MACD tip. I've gone back to analyze currency performance based on MACD fluctuation. It can definitely be a great signal in my opinion!
It is, combine it with RSI and you are golden
Also check out Bollinger Bands...very useful tool
Ahh, yes. I like using Bollinger bands to help indicate whether the price is either above average for its volume or below. I successfully used them this morning to make a nice return on a few different margin calls.
Keep trading simple, I use this indicator myself as well but a few more with it though, but it's definitely useful
Yes , RSI and MACD are my favorite...also like volume.
Thanks for commenting!
Peace, Abundance, and Liberty Network (PALnet) Discord Channel. It's a completely public and open space to all members of the Steemit community who voluntarily choose to be there.Congratulations! This post has been upvoted from the communal account, @minnowsupport, by krypto101 from the Minnow Support Project. It's a witness project run by aggroed, ausbitbank, teamsteem, theprophet0, and someguy123. The goal is to help Steemit grow by supporting Minnows and creating a social network. Please find us in the
If you like what we're doing please upvote this comment so we can continue to build the community account that's supporting all members.
Thanks for the summary of the RSI indicator, it is in my to 3 trading tools.
This post has received a 2.57 % upvote from @booster thanks to: @krypto101.
So what does RSI say about buying BTC?
STEEM On !!
Dave
BTC always looks good to buy...specially now...same time next year we will laugh at that price
Source: http://www.buonaopzione.it/strategie-opzioni-binarie/strategia-indicatore-rsi
Not citing the source of photos(images) is plagiarism. Here is a post on why this is bad, and here is how easy it is to find allowed photos.
Creative Commons: If you are posting content under a Creative Commons license, please attribute and link according to the specific license. If you are posting content under CC0 or Public Domain please consider noting that at the end of your post.
Not indicating that the content you copy/paste is not your original work could be seen as plagiarism.
If you are actually the original author, please do reply to let us know!