
Welcome to the monthly financial report about the Hive blockchain.
All the information presented in this report is based on the data collected from the blockchain until 2025-04-10 midnight UTC. This report aims to provide you with a clear view of what is happening on the Hive blockchain.
1. Price
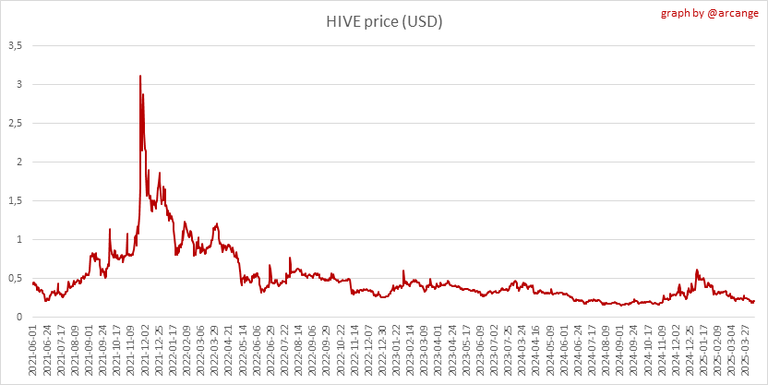 | 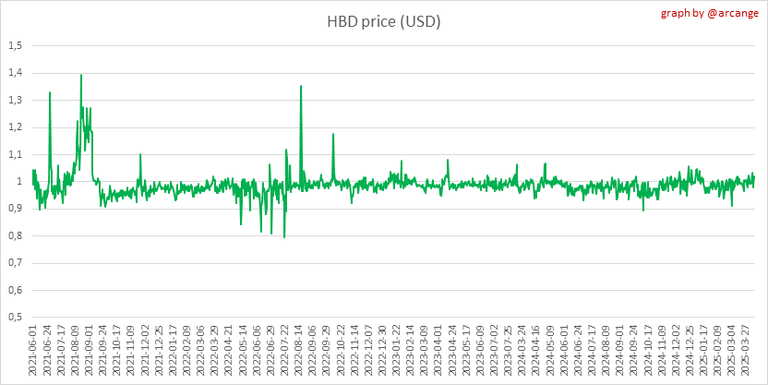 |
These graphs show the evolution of prices in USD for HIVE and HBD.
2. Supply
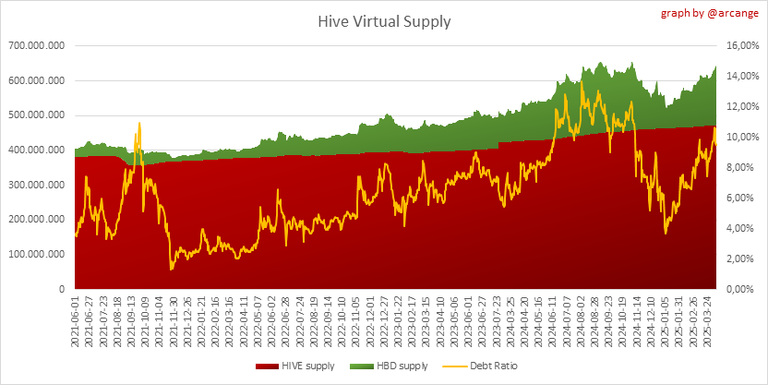
This graph shows the evolution of HIVE virtual Supply. The virtual supply is the sum of HIVE supply (liquid and staked HIVE) and HBD supply (converted into HIVE).
The graph also displays the debt ratio (HBD supply / HIVE virtual supply). Keep in mind that since hardfork 24 funds in the treasury (@hive.fund HBD balance) don't count towards the HBD debt ratio.
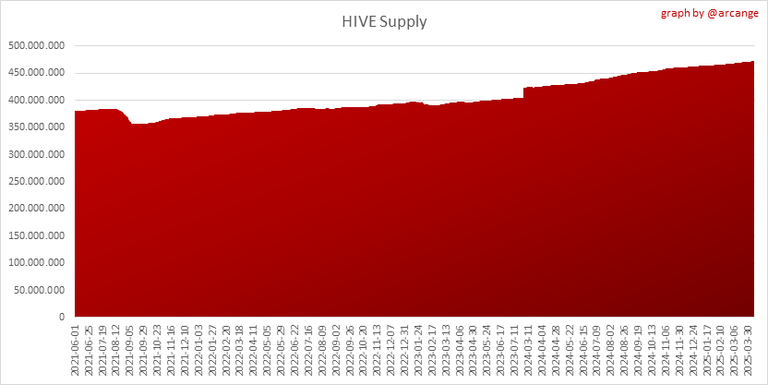 | 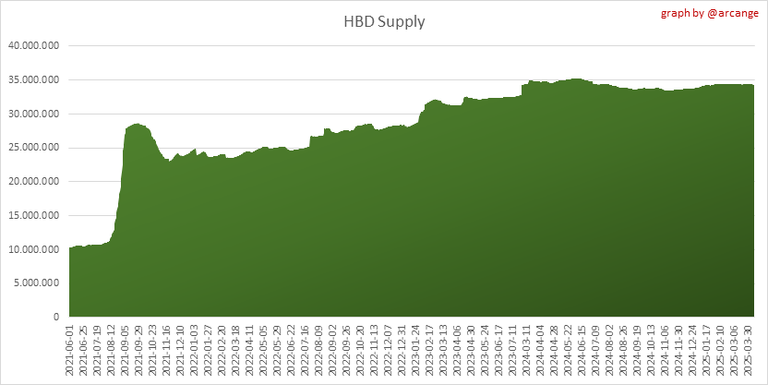 |
These graphs show the evolution of the HIVE Supply (both liquid and staked) and the HBD supply.
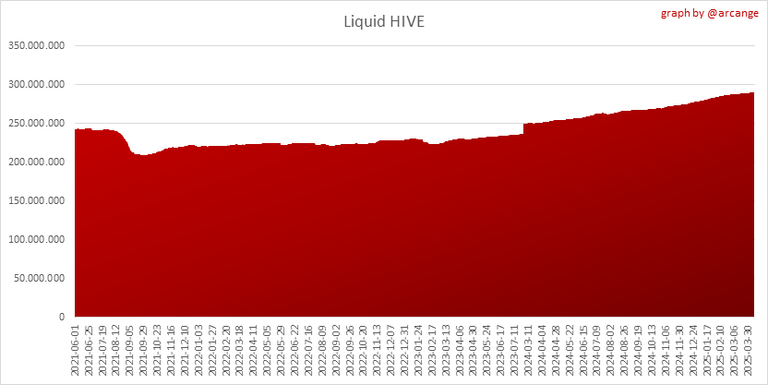 | 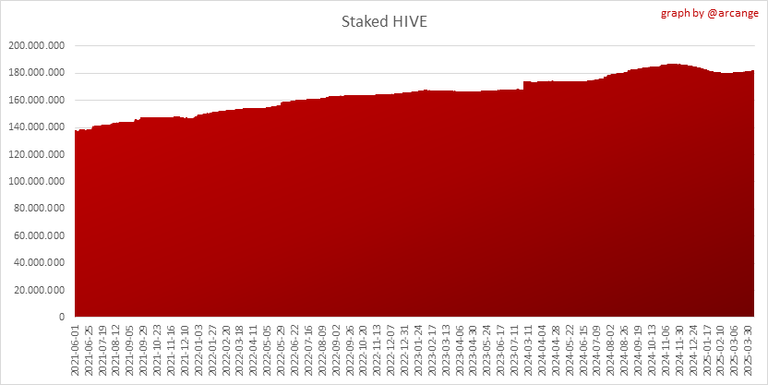 |
These charts show the evolution of the liquid HIVE and the staked HIVE (Hive Power).

This graph shows the overall Hive tokens distribution.
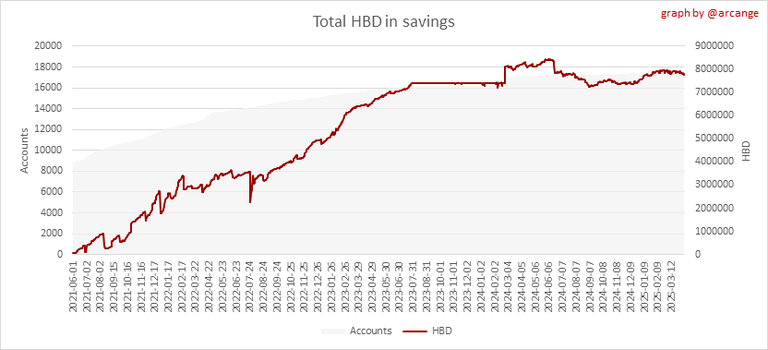
3. HBD Savings
| Account | Deposit | Account | Withdrawal |
|---|---|---|---|
| @lordbutterfly | 5,183.437 HBD | @paleking | 24,081.865 HBD |
| @eil7304 | 1,117.131 HBD | @aerox | 2,000.000 HBD |
| @ynah.artchi | 610.000 HBD | @lazy-ninja | 1,448.693 HBD |
| @howo | 330.002 HBD | @dbooster | 813.380 HBD |
| @pepeteam | 240.212 HBD | @steemychicken1 | 611.647 HBD |
| @m0rph | 235.000 HBD | @improv | 508.902 HBD |
| @jesuslnrs | 220.000 HBD | @artakush | 500.000 HBD |
| @bhattg | 186.478 HBD | @viviehardika | 500.000 HBD |
| @pepetoken | 180.276 HBD | @notaboutme | 496.777 HBD |
| @focus.folks | 152.549 HBD | @medical-hall | 431.891 HBD |
This graph shows how much and how many accounts store HBD in savings. The table below shows the topmost HBD deposits and withdrawals of the day.
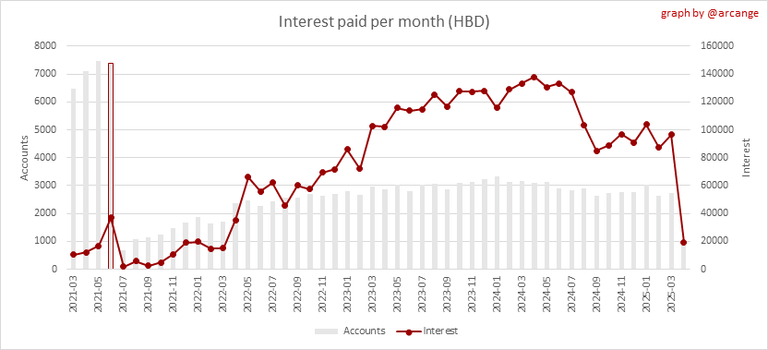
Note: As of 2021-06-30 (HF25) interest is only paid for HBD which are stored in savings.
This chart shows the amount of interest paid each month for holding HBD and how many accounts received such interest.
4. Balances

This graph shows the number of HIVE, both liquid and in savings, held by all accounts.
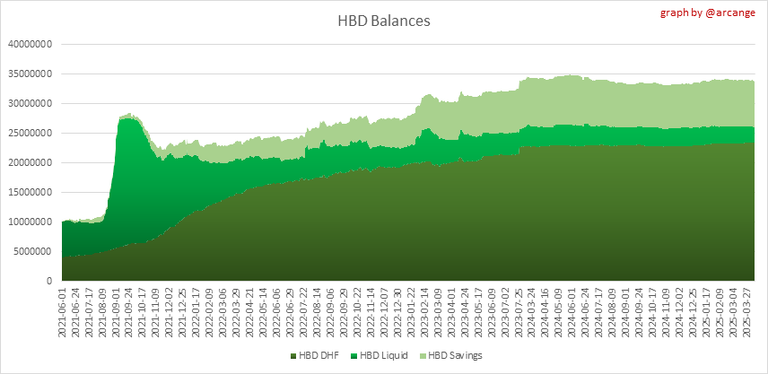
This graph shows the number of HBD, both liquid and in savings, held by all accounts. It also displays the amount of HBD stored in the Decentralized Hive Fund (DHF).
5. Conversions
Note: As a reminder, conversion requests are only finalized after 3 days. It is only then that it is known exactly how many HIVE were burned in return for the HBD received at the time of the conversion request.
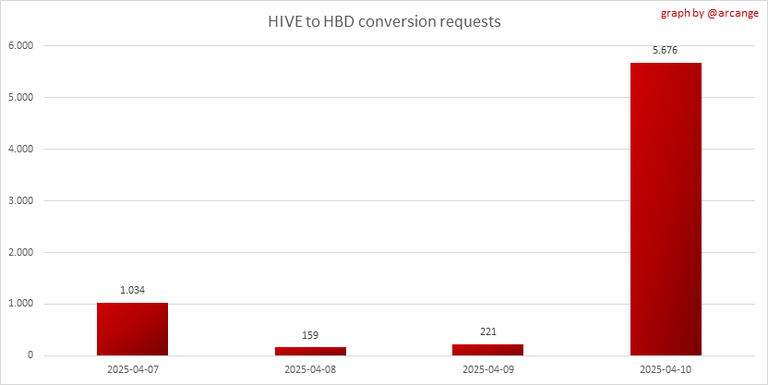
This graph shows the number of HIVE collateralized due to requests to convert HIVE to HBD over the past few days.
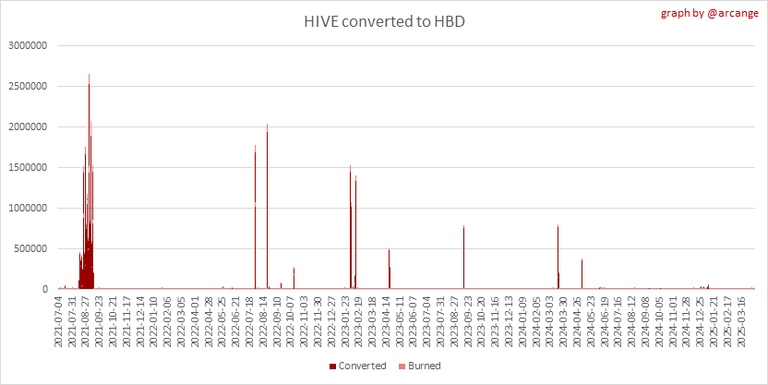 | 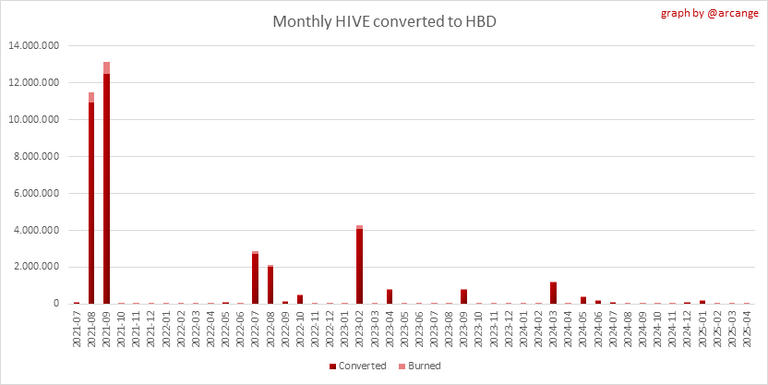 |
These graphs show the number of HIVE effectively used by the conversion process (HIVE converted and 5% HIVE fee which is burned) each day and month when requests to convert HIVE to HBD have been finalized.
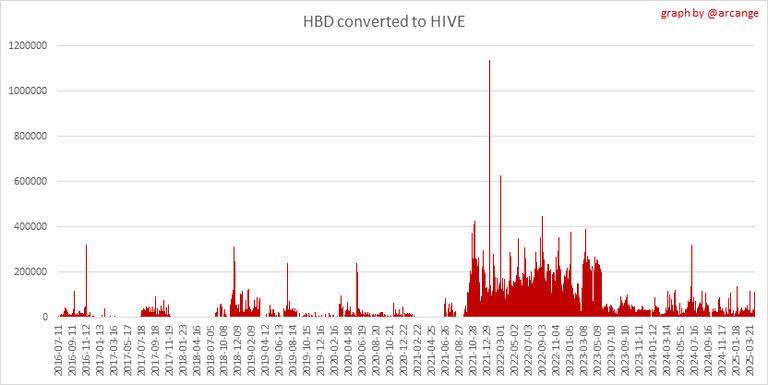 | 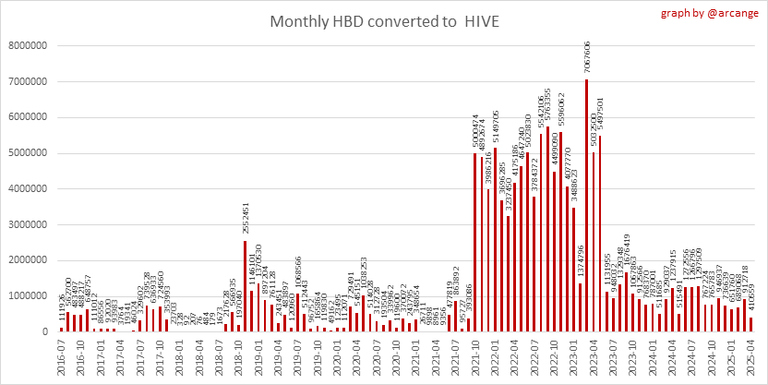 |
These graphs show the number of HBD burned, each day and each month, following requests to convert HBD to HIVE.
6. Powerup and Powerdown
| Date | Account | Amount |
|---|---|---|
| 2025-04-10 10:55:18 | @ecoinstats | 130,004.649 HIVE |
| 2025-04-10 02:20:24 | @qurator | 37,859.285 HIVE |
| 2025-04-10 03:07:24 | @cur8 | 4,135.637 HIVE |
| 2025-04-10 11:29:39 | @kwick | 3,865.267 HIVE |
| 2025-04-10 11:45:48 | @princekham | 2,600.085 HIVE |
| 2025-04-10 05:55:30 | @bipolar95 | 2,500.243 HIVE |
| 2025-04-10 05:55:54 | @bipolar95 | 2,000.194 HIVE |
| 2025-04-10 08:06:48 | @splinterboost | 1,774.604 HIVE |
| 2025-04-10 05:42:39 | @rostik924 | 1,747.171 HIVE |
| 2025-04-10 05:38:39 | @bipolar95 | 1,000.098 HIVE |
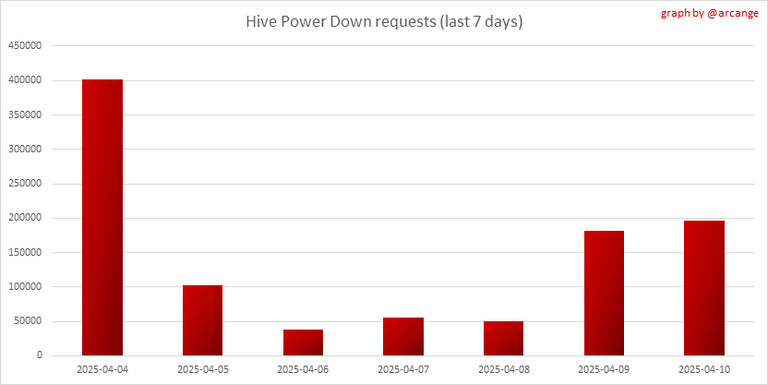
This graph and table show the amount of powerdown initiated over the last 7 days, and the largest initiated on this day.
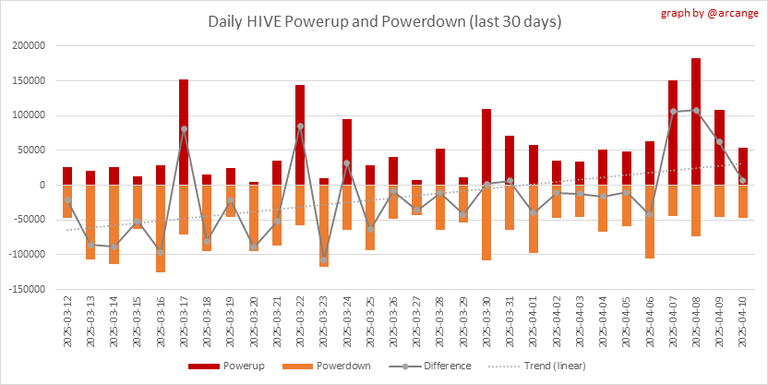
| Account | Powerup | Account | Powerdown |
|---|---|---|---|
| @geekgirl | 42,350.864 HIVE | @ocdb | 11,141.106 HIVE |
| @emrebeyler | 3,207.506 HIVE | @ocd-witness | 4,634.841 HIVE |
| @magicmonk | 2,809.188 HIVE | @roelandp | 4,474.898 HIVE |
| @assistance | 677.511 HIVE | @johannpiber | 3,080.542 HIVE |
| @tamiil | 613.531 HIVE | @kirstin | 2,058.529 HIVE |
| @newigennity | 380.276 HIVE | @yixn | 1,632.032 HIVE |
| @mineopoly | 358.000 HIVE | @barmbo | 1,484.392 HIVE |
| @uwelang | 351.971 HIVE | @jongolson | 1,168.640 HIVE |
| @oladams | 297.196 HIVE | @edicted | 1,005.151 HIVE |
| @kryptokraftwerk | 253.918 HIVE | @rivalzzz | 780.151 HIVE |
This graph shows the daily HIVE power-up, power-down, and the resulting variation over the last 30 days. The table shows the topmost power-ups and power-downs of the day.
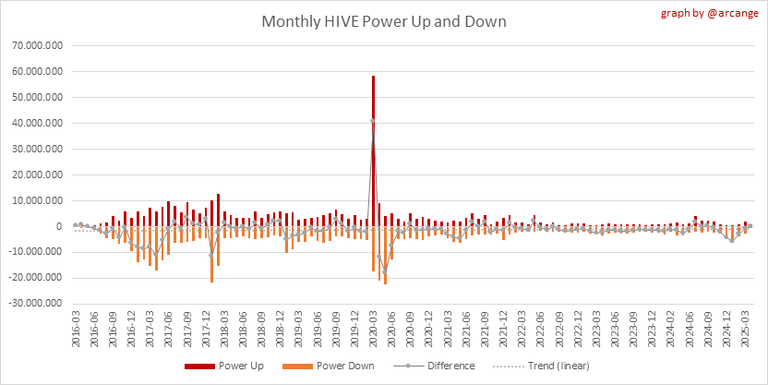
This graph shows the monthly HIVE power-up, power-down and the resulting variation.
Values for the last 3 months
| Period | Powerup | Powerdown | Difference |
|---|---|---|---|
| 2025-04 | 783,517.000 | 632,908.000 | 150,609.000 |
| 2025-03 | 1,816,802.000 | 2,601,302.000 | -784,500.000 |
| 2025-02 | 1,065,696.000 | 3,856,676.000 | -2,790,980.000 |
7. Transfers
These graphs show the volume (in USD) of HIVE and HBD transferred between accounts.
8. Exchanges
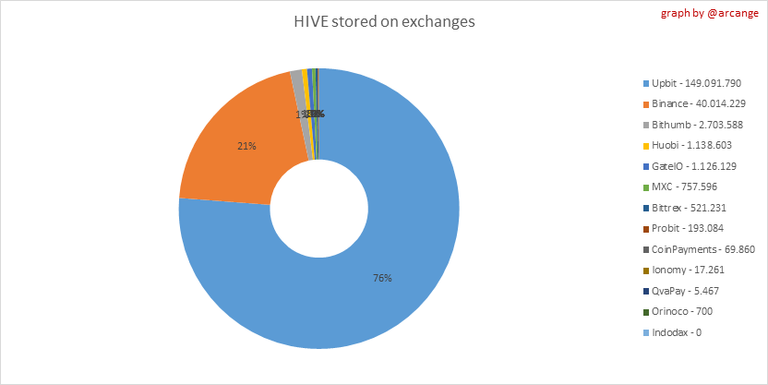 | 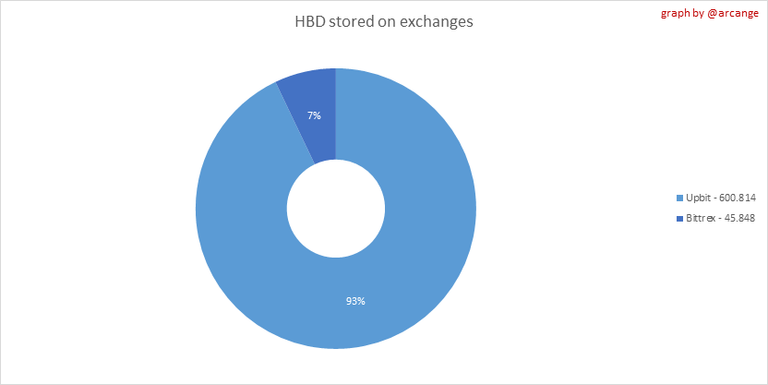 |
These graphs show the amount and distribution of HIVE and HBD stored on the exchanges where they are listed.
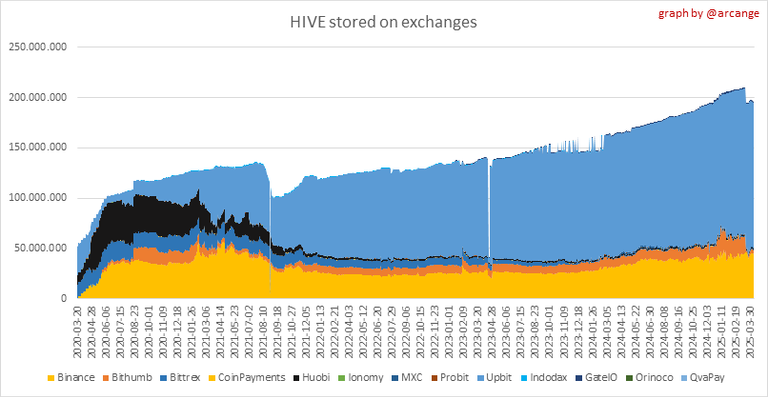 | 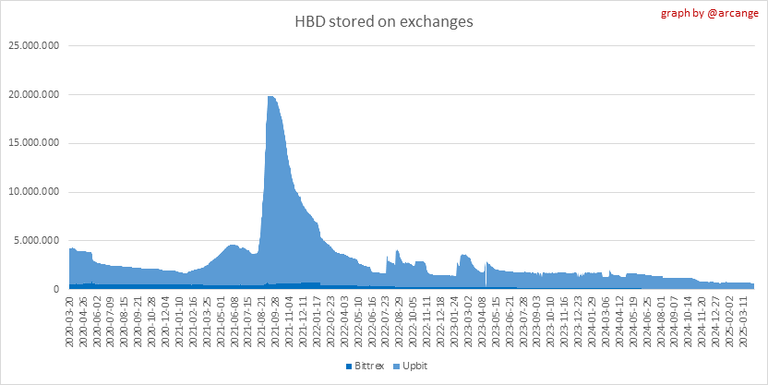 |
These graphs show the daily evolution of HIVE and HBD stored on the exchanges where they are listed.
I hope you find those stats useful. If you would like to see additional stats, feel free to drop me a comment. Your feedback is more than welcome.
Thanks for reading.
Check out my apps and services


Thank you very much for sharing these lovely pictures.
What does it all mean? !LOLZ
I would be interested in your thoughts on the data from a high level perspective. Maybe add a summary/conclusion section.
For example,
Hive price is on a continued decline since Dec 2024 peak near 0.620 and today near 0.219
Hive/HBD supply is growing and back at a level near the high of October 2024 after dropping around 2% at the start of 2025. Not sure how to read the debt ration line. The line is going up, Does it mean debt is going up? Amount of Hive in system is up and HBD is down?
3/4. HBD Savings has been relatively flat or not increasing since October 2023 while Hive supply continues to grow.
etc
!LUV the data and could benefit from some translation. At the very least it could help reinforce a view of what appears to be unfolding. Or challenge a different view. Does my quick interpretation of the data for item 1-4 make sense?
Thanks again for all you do to support our Hive community.
Much appreciated.
!BEER
!PIZZA
Thank you for the work that you are doing for Hive progress
$PIZZA slices delivered:
(2/5)
fjworld tipped arcange @pixresteemer tipped @arcange
Moon is coming
So much liquid hive wtf Oo
!PIZZA
Weird seeing myself on this list with such a small powerdown.
Interesting.
The amount of Hive on the Bithumb exchange went from 17 million to less than 3 million. That seems odd considering the trend on the other exchanges. Is there a mistake in the data or is something else going on? What hive account(s) are you tracking for this exchange?
Thanks much again for very interesting Hive Statistics, @arcange! 😁 🙏 💚 ✨ 🤙